

ZEC trades near $559 after pulling back from $650–$680 resistance, with $520 support and the $700 zone in focus.
ZEC price action has returned to focus as traders compare the latest rally with the November move into the same resistance area.
ZEC/USD recently approached the $650 to $750 zone, while the chart showed a double top setup and a pullback toward key support levels.
ZEC Rally Meets the Same Resistance Zone
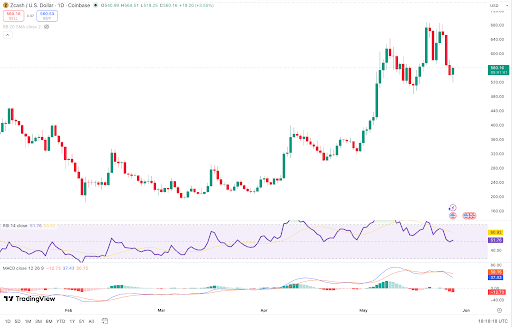
ZEC climbed toward the $700 region after a strong recovery from the April base. The move started near the $220 to $260 area, then gained speed through May.
Price later reached the $650 to $680 zone, where buying momentum started to slow.
Traders are watching the $650 to $750 range because it also capped the November rally.
Both moves pushed into the same area before losing strength. Market watchers said the two structures showed a similar double top pattern.
What’s been interesting about ZEC’s move to $700 is how similar the structure is compared to the November rally into the exact same region.
Each rally pushed into the same $650–$750 area, where momentum started slowing down on both occasions.
Both structures then topped… https://t.co/rOsL2s4kXu pic.twitter.com/F4ncybUbZA
— Ardi (@ArdiNSC) May 28, 2026
The pattern included a first high, a pullback, a second high, and a failed breakout. That sequence has drawn attention from chart analysts.
However, the latest rally has shown higher lows, while the November move had a sharper blow-off top.
Key Support Levels Come Under Pressure
ZEC/USD traded near $559 after rebounding from a recent low around $520. The chart showed buyers defending the $520 to $530 area for now.
This zone remains important because it has already attracted demand during the latest pullback.
Traders also pointed to the loss of compound support near $600. The double top neckline near $570 was also tested and lost.
Price then moved into the macro support area near $540, which marked the expected downside swing.
One trader described the move as a “10% swing move to the downside” after support failed.
The same trader said the macro support area must hold for further uptrend continuation. More tests of that level could reduce its strength as liquidity gets drawn.
Would you look at that..
1. Compound support at $600 lost.
2. Double Top neckline at $570 tested and lost.
3. Price moves straight into macro support at $540.Result.. we got the expected 10% swing move to the downside. 🎯
What an execution of our setup. Can’t say you… https://t.co/63ryLXe8gc pic.twitter.com/fftxtyON2i
— Ardi (@ArdiNSC) May 27, 2026
If ZEC loses the $520 to $530 zone on a daily close, lower levels may come into focus. The next areas sit near $500 and $480.
A deeper move could bring the $420 to $440 support zone back into view.
Read Also:
Zcash (ZEC) Price Faces Heavy Pressure, Eyes $300 After Core Developer Split
Indicators Show Cooling Momentum
The daily RSI stayed near 52, which showed neutral momentum. It has cooled from higher levels, but it has not moved into bearish territory.
This suggests the market is pausing after a strong rally, rather than confirming a full trend break.
The MACD showed weaker short-term momentum. The MACD line remained below the signal line, and the histogram stayed negative.
Even so, the MACD remained above the zero line, so the broader trend has not fully broken.
On the upside, ZEC needs to reclaim $565 to $580. A clean move above that area could open a retest of $600 to $620.
If buyers regain control above $620, the $650 to $680 resistance zone would return to focus.
For now, traders are watching whether support near $520 can hold. A break below that area could shift attention toward $500 and $480.
A move above $580 to $600 would be the first signal that buyers are returning.





Leave feedback about this