

Solana price has fallen nearly 4% to about $74 after a rejection near $77, as a global technology sell-off and leveraged long liquidations have pushed traders toward caution.
Summary
- Solana price tests $74 support after losing its rising trendline and facing weak four-hour momentum.
- A recovery above $76.50 could trigger short liquidations and drive SOL toward $78–$80.
- Losing $74 would expose the daily Supertrend support at $69.60 and deepen downside risks.
According to data from crypto.news, Solana (SOL) price extended its decline on July 17 after failing to hold above the $76.50–$77 resistance area. Selling accelerated as semiconductor shares led losses across global markets, with Nasdaq 100 futures down 1.8%, Japan’s Nikkei 225 off 4%, and Taiwan’s benchmark plunging more than 6%.
The drop can partly be attributed to the rout due to doubts over stretched artificial intelligence valuations and leveraged retail positions.
Strong U.S. data added pressure on speculative assets. Initial unemployment claims fell to 208,000 from 216,000, while June retail sales rose 0.2%. The 10-year Treasury yield climbed toward 4.60%, and the dollar strengthened, raising the cost of holding high-beta assets such as Solana.
Institutional demand has provided only limited relief. U.S. spot Solana exchange-traded funds attracted $8.36 million on July 6, their strongest daily intake in almost two months, per data from SoSoValue. However, the inflow was not enough to prevent SOL from retreating from its early-July high near $83.
Solana price can rebound if bulls reclaim $76.50
On the 4-hour chart, SOL trades near $74.87 and has reached the lower Bollinger Band at $74.33. The middle band at $76.51 now serves as immediate resistance, while the upper band sits at $78.69. A 4-hour close above the midpoint would give buyers another chance to test the $78–$80 region.
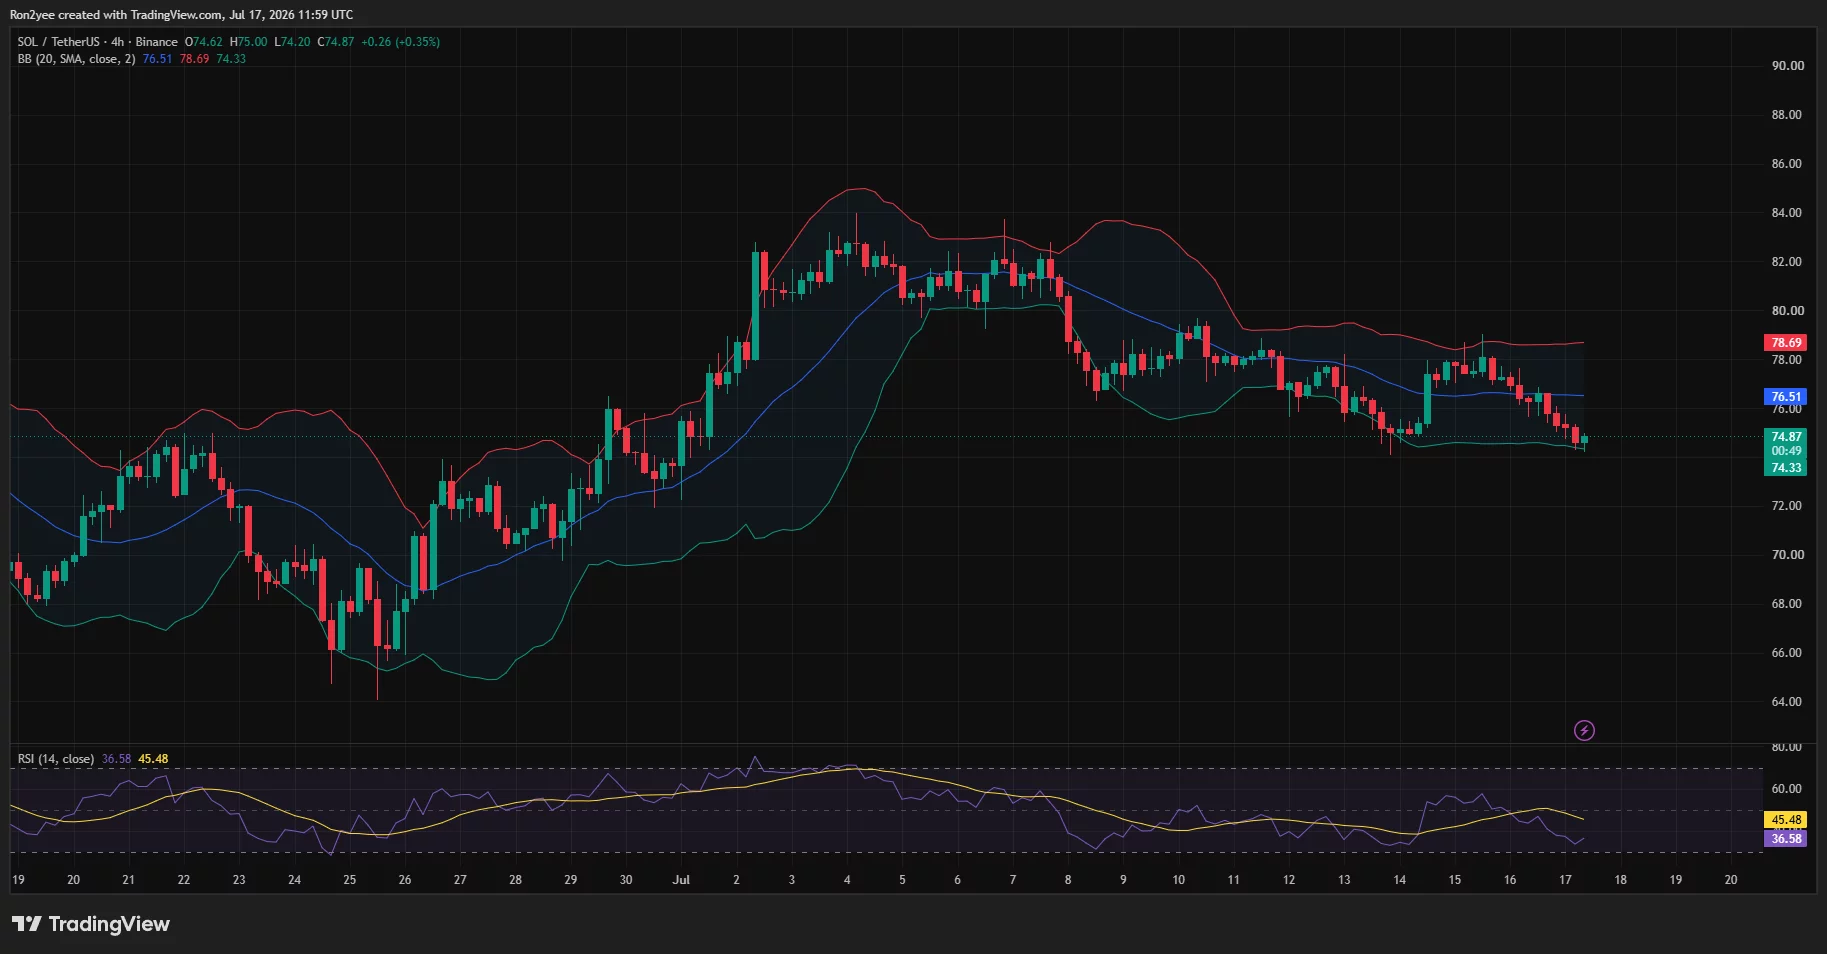
Momentum remains weak but is approaching levels where relief rallies can develop. The 4-hour relative strength index has dropped to 36.58, below its signal average of 45.48 but still above the oversold threshold of 30. Price has also formed a sequence of lower highs since its July 4 peak near $83.
According to crypto analyst SatoshiOwl, SOL has reached a support area after breaking beneath an ascending trendline.
“Hold here and we could see a relief bounce back toward $78–$80. Lose it, and a deeper flush becomes much more likely.”
Ali Charts offered a longer-term counterpoint, noting that the TD Sequential indicator has produced a buy setup on Solana’s monthly chart. The analyst described it as a potential early warning of a macro trend change, although the monthly setup requires confirmation from shorter time frames.
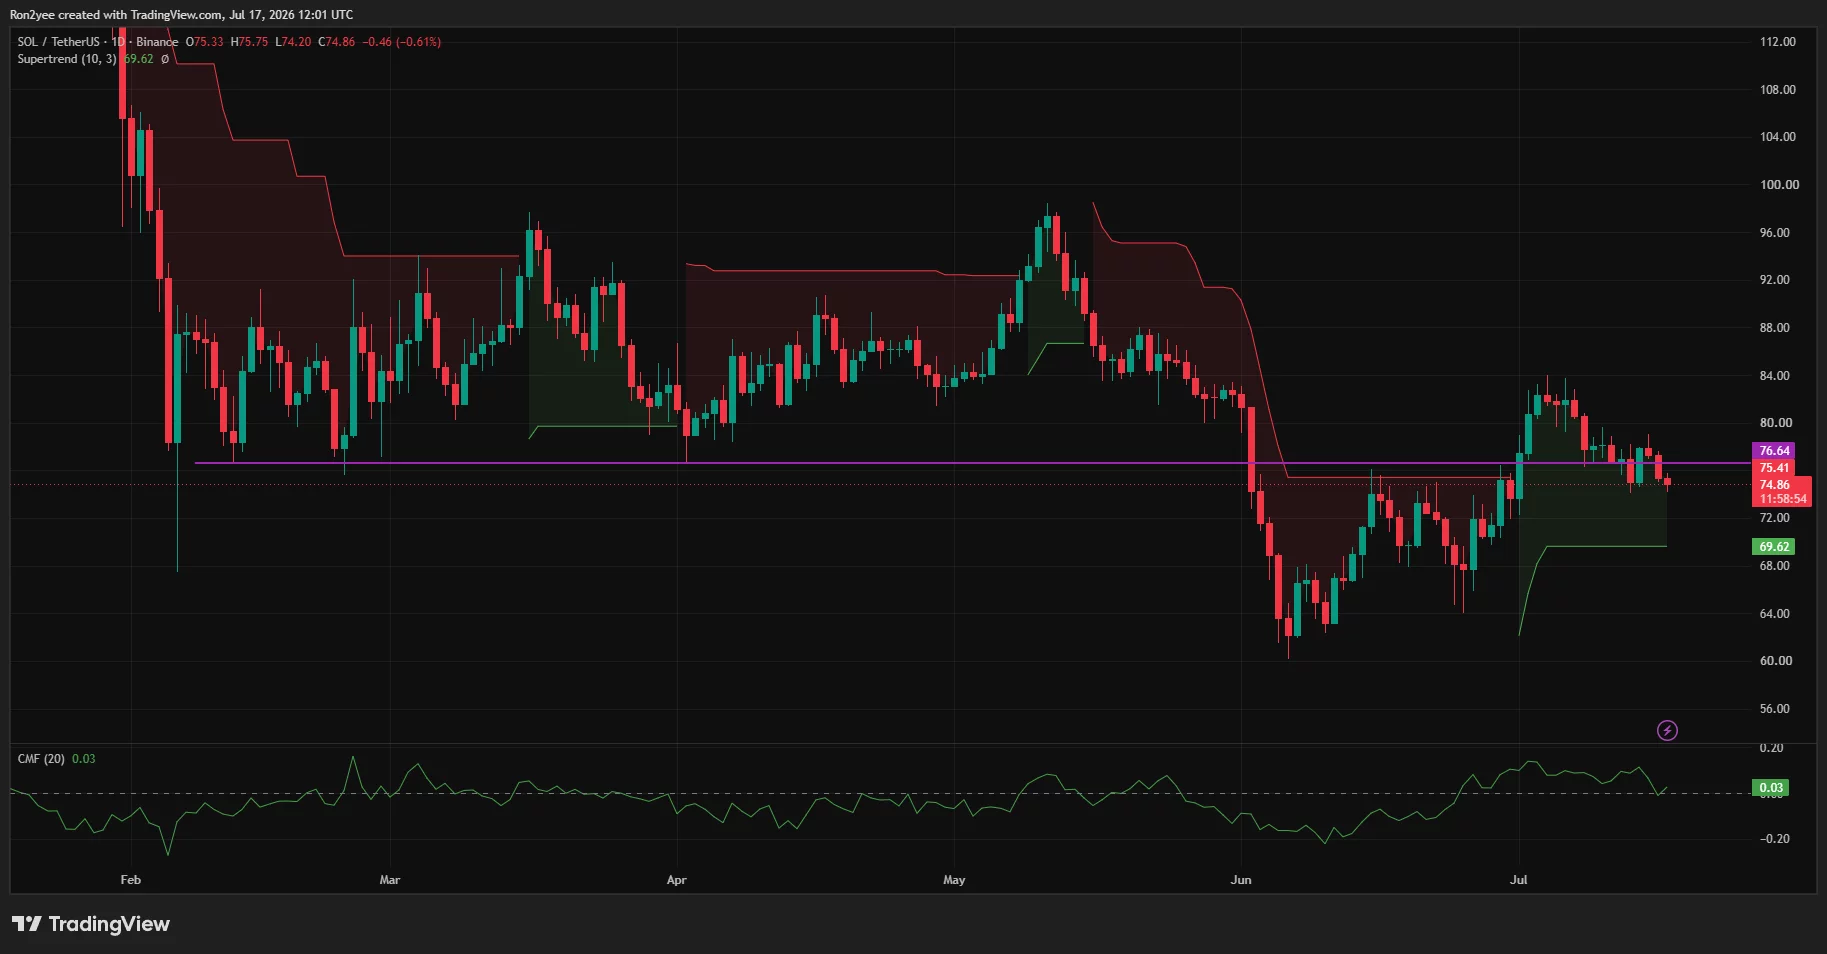
The daily chart remains constructive above the Supertrend support at $69.62. Chaikin Money Flow stands at 0.03, which shows that capital flow is still marginally positive despite the latest sell-off. SOL must first recover the former horizontal support at $76.64 before the daily structure can improve.
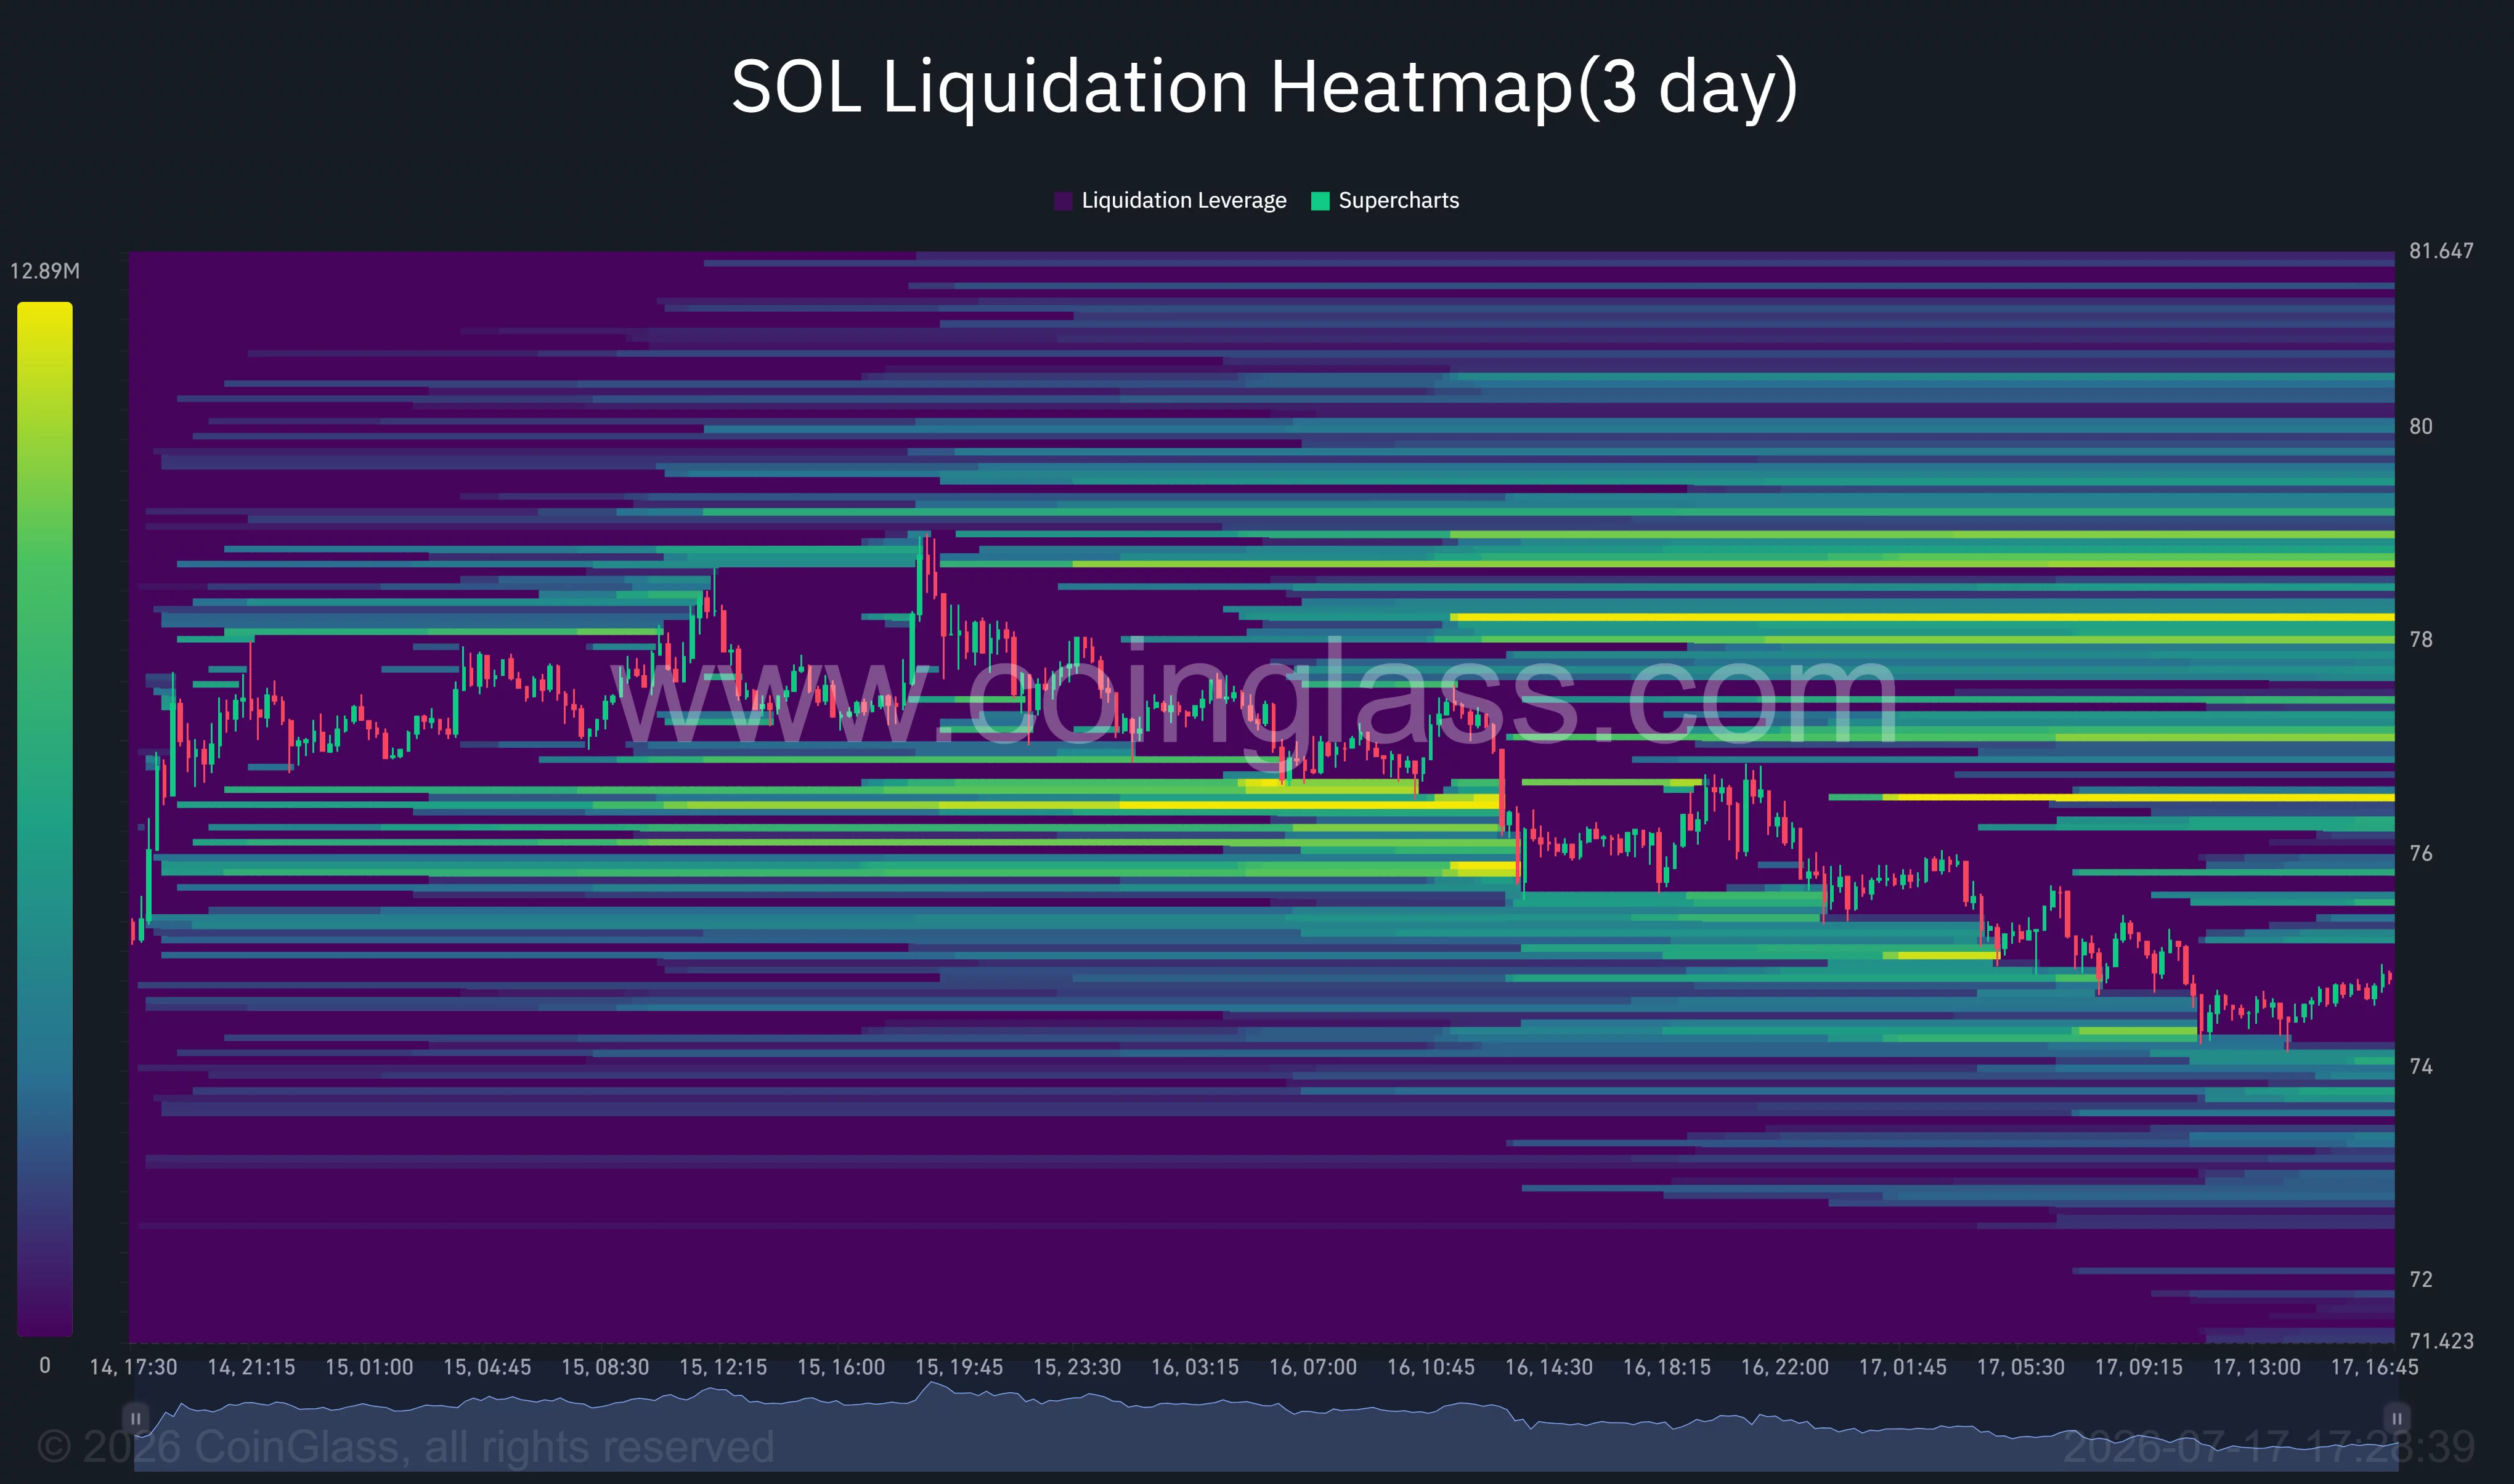
CoinGlass’ three-day liquidation heatmap places the nearest large pools of leveraged positions above the market. Dense clusters sit near $76.50–$76.70, $78, and $78.70, making those levels possible price magnets if SOL rebounds. A move through $76.70 could liquidate short positions and accelerate a recovery toward $78.
A break below $74 would expose the $69.60 support zone
Downside risk will rise if SOL closes decisively below the $74–$74.30 area. The heatmap shows less concentrated liquidity immediately beneath the current price, leaving room for a quicker decline toward $72 before the daily Supertrend level near $69.62 comes into play.
A loss of $69.62 would invalidate the remaining bullish daily setup and expose the June recovery base between $64 and $66. Macroeconomic pressure could deepen that move if Treasury yields continue higher, technology shares extend their decline, or renewed U.S.-Iran tensions lift oil prices and reduce demand for risk assets.
For now, SOL remains caught between weak four-hour momentum and positive daily capital flow. Bulls need $76.50 back to target the liquidity stacked near $78–$80, while a failure to protect $74 would place the $69.60 trend support at risk.
Disclosure: This article does not represent investment advice. The content and materials featured on this page are for educational purposes only.





Leave feedback about this