

Solana price is pushing back toward $140 as rising volume and improving indicators show there may be a potential major move ahead.
Summary
- SOL traded at $138 on Dec. 10 with a strong rebound in daily trading volume.
- Liquidity metrics show a deep-cycle reset that often comes before fast upside moves.
- Technical indicators and upcoming Solana Breakpoint 2025 event support a potential recovery.
Solana was trading at $138 on Dec. 10, up 5% in the past 24 hours. Over the last week, the price has moved between $128 and $145, though it’s still down by 17% over the past month.
Trading activity has picked up again, with $6.97 billion in volume recorded in the last day, which is a 34% jump and shows stronger market interest on both spot and futures markets.
CoinGlass data shows Solana (SOL) derivatives volume rising 23% to $18 billion, while open interest moved 2.3% higher to $7.25 billion.
When open interest climbs during a quiet price phase, it often means traders are slowly adding exposure instead of stepping away. This tends to happen when the market is preparing for a shift.
Liquidity signals point to a full reset
On Dec. 10, Glassnode noted that Solana’s Realized Profit-to-Loss Ratio (30-day SMA) has stayed below 1 since mid-November. In simple terms, the market has been closing more losing trades than winning ones. This usually happens during deep reset phases, where liquidity dries up before a new cycle begins.
Analysts at Altcoin Vector recently said Solana is going through a “full liquidity reset,” a stage seen in past bottom periods. During these moments, forced selling slows down, weak hands leave the market, and the ecosystem starts to heal.
They noted that when liquidity finally turns upward, the price often moves fast, kicking off multi-week rallies and drawing fresh interest into altcoins. Their timeline pointed to early January for a possible shift, although they also said it could happen sooner.
This week’s Breakpoint 2025 Conference (Dec. 11–13) may add fuel to that recovery. The event is likely to bring updates on real-world assets, new partners, and fresh on-chain revenue ideas. Such themes often attract major firms.
Solana price technical analysis
SOL is trading above the lower Bollinger Band at about $135 on the daily chart, and it is gradually moving back toward the middle band at $145. Although the relative strength index is at a neutral 48, it has been rising since the decline last week.
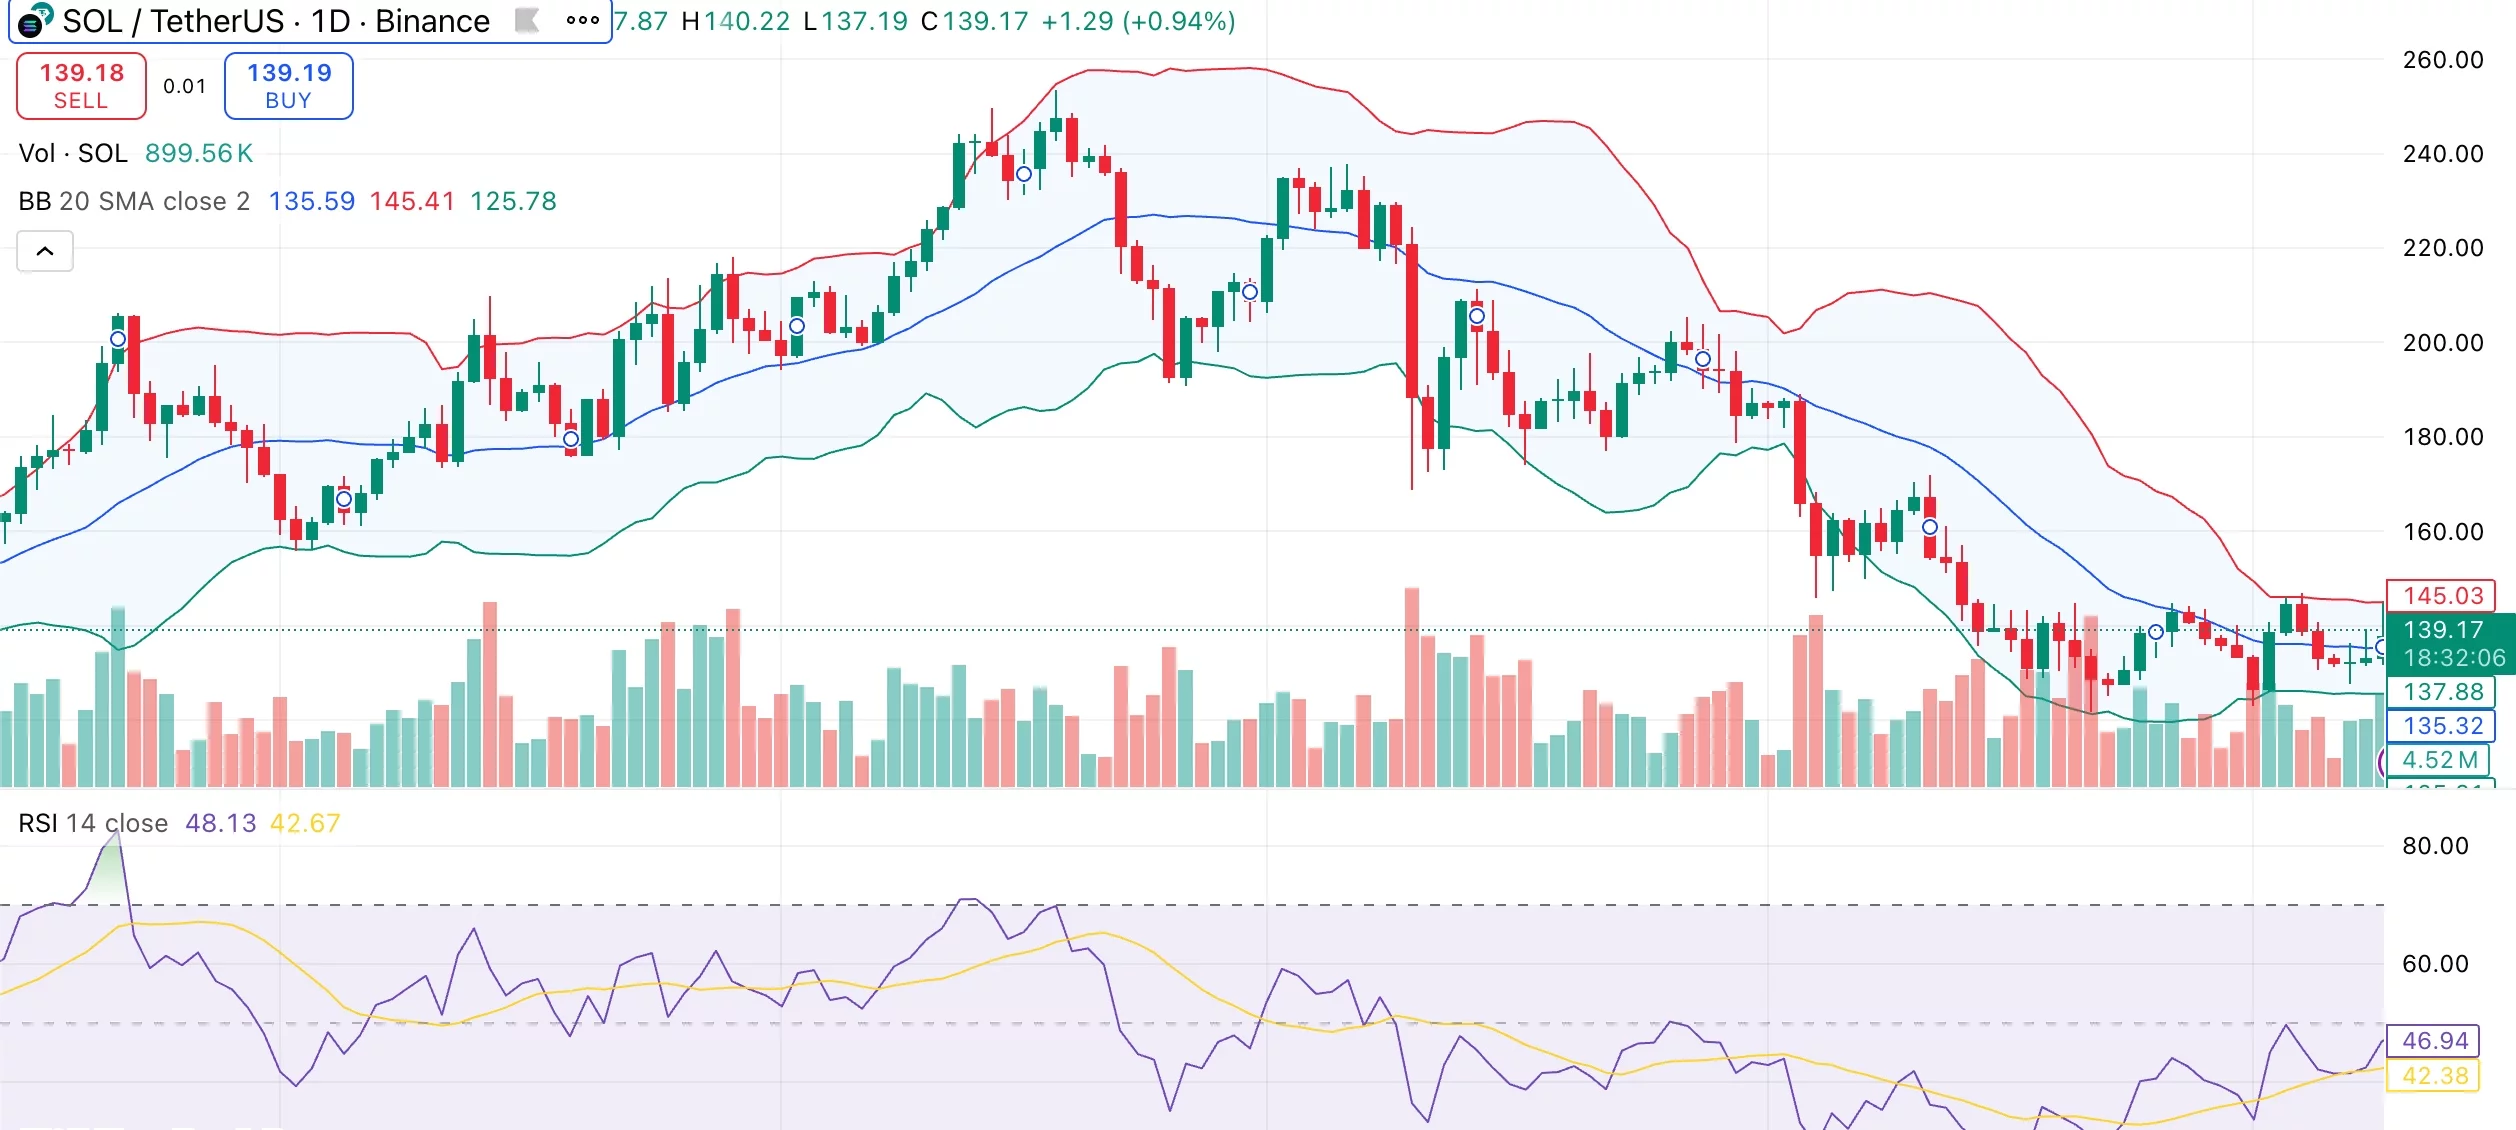
Other momentum signals are improving as well, and the MACD is just starting to turn positive, which could be an early sign that SOL is preparing for a potential rebound.
Now serving as close support, short-term moving averages like the 10-day and 20-day are located just below the current price. Solana needs more strength to break out of its wider decline because longer-term averages are still above the price.
If the price closed above $145, bulls would have an easier path to $160, whereas a rejection could drive the price back toward $135. Solana seems to be going through a reset phase right now, which usually comes before a new cycle.


Leave feedback about this