

A technical breakdown of Solana daily, four-hour, and one-hour charts, mapping liquidity pools and order blocks to the levels that decide what SOL does next.
A Rally Nobody Saw Coming
Solana spent most of August grinding sideways between $72 and $80. The kind of range that puts most traders to sleep, honestly. Then September hit and the coin broke out hard, eventually tagging $120 on the 22nd before sellers leaned back in.
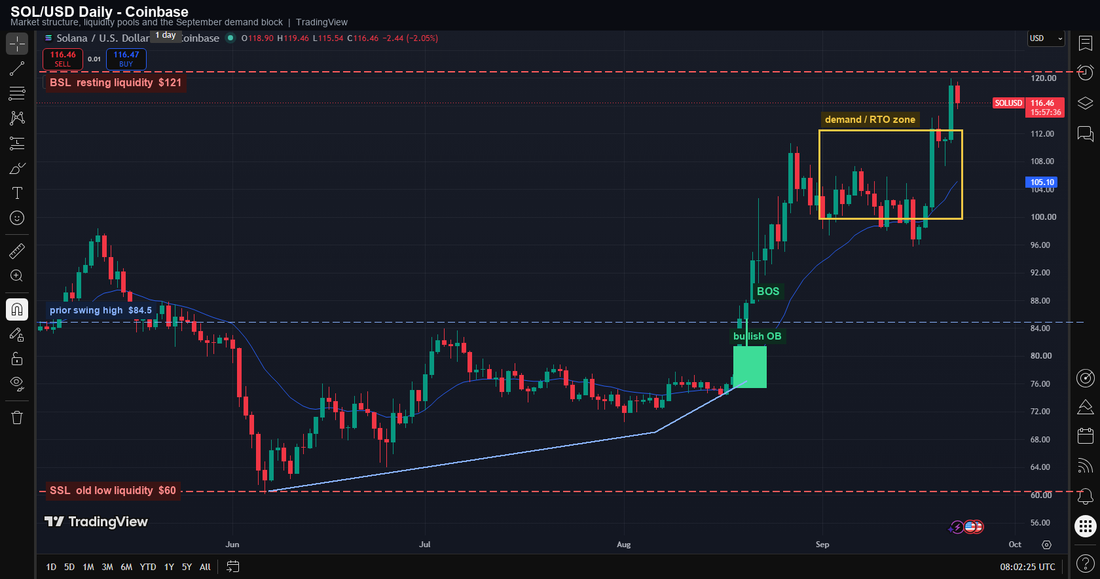
The daily chart is where the real story sits. Solana had fallen to a low near $60 back in June. It spent the summer building a base, quietly, and only turned aggressive once buyers had defended $76 three separate times.
Where The Real Demand Sits
Zoom into the daily candles and a demand zone shows up between $76 and $81. Almost exactly where the September rally launched from. It also lines up with the old July high near $84.50, a level that flipped from resistance into support once price closed above it.
There’s a rising trendline connecting the June low, the August range floor, and the breakout candle itself. Pullbacks keep respecting that line so far, and while that holds, the daily structure still favors buyers over sellers.
SOL/USD Daily chart. Source: TradingView / Coinbase.
The Four Hour Picture Moves Faster
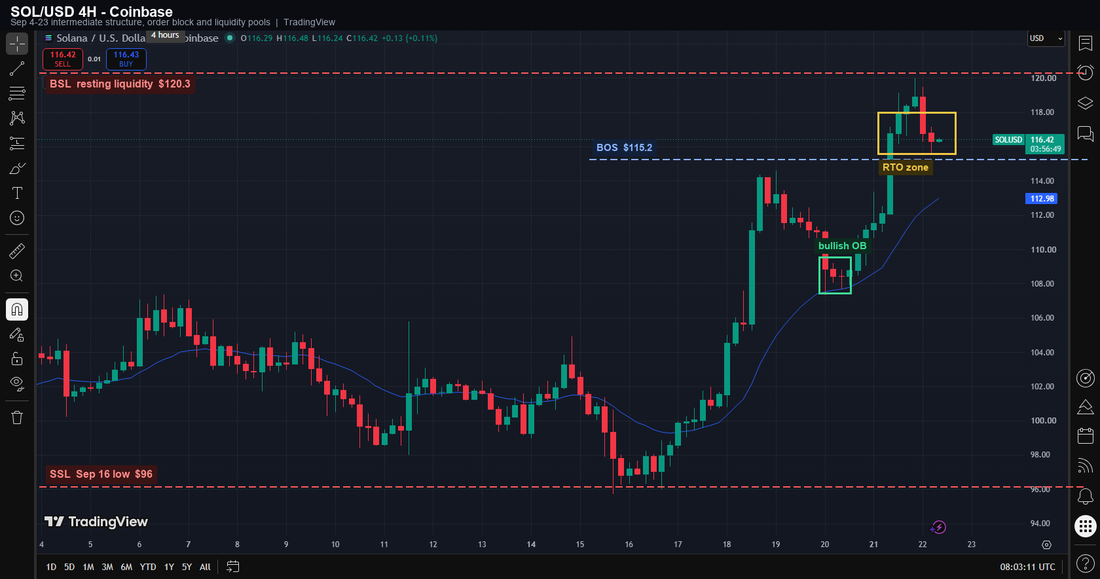
Drop to the four-hour chart and September 16 becomes the anchor point, a swing low near $96. SOL broke structure twice from there. First clearing $115, then printing a fresh high above $120 a few days later.
There’s a tighter order block between $107 and $109.50, the last red candle before the impulsive leg into the $118 to $120 zone. That candle is the first real test now, assuming the pullback keeps going.
SOL/USD 4H chart. Source: TradingView / Coinbase.
One Candle Flipped The Bias
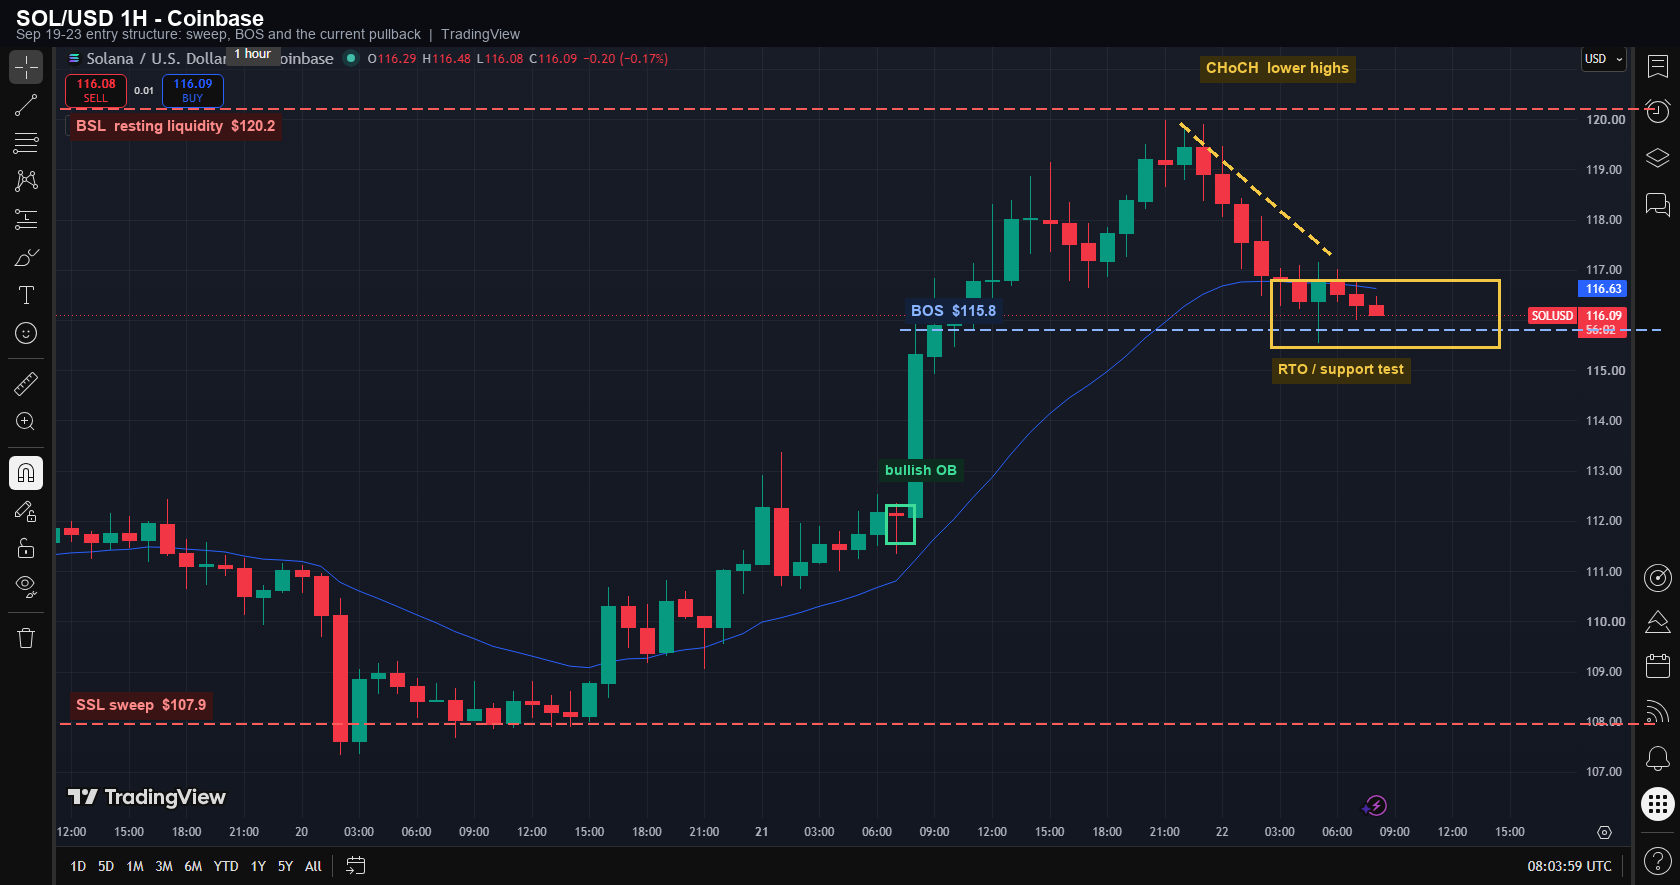
The one-hour chart is where the entry logic actually lives. Price swept $107.90 on September 20, grabbing the stops sitting under the prior range low, then reversed hard through $112.
That reversal candle is the bullish order block worth watching right now. Price broke $115.80 cleanly, kept climbing into $120, then started printing lower highs. Not a huge signal on its own. But an early change of character, and one worth respecting rather than ignoring.
SOL/USD 1H chart. Source: TradingView / Coinbase.
What The Liquidation Map Confirms
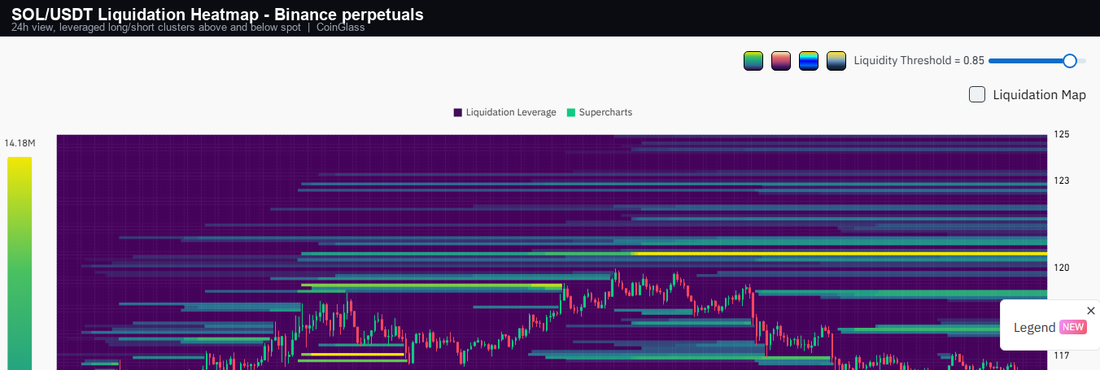
CoinGlass data backs up the chart read. The Binance SOL/USDT liquidation heatmap shows a thick band of leveraged shorts resting just above $120. That spot lines up with the daily buy side liquidity pool almost to the dollar.
A similar setup showed up recently on XRP’s own liquidity map, where mapped pools lined up closely with the pair’s next real move. If SOL trades back into that $120 pocket, those stacked shorts become fuel for another leg higher rather than a wall.
SOL/USDT liquidation heatmap, Binance perpetuals. Source: CoinGlass.
What Breaks The Current Pullback
The zone to watch sits at $115 to $116.80 on the one-hour chart, the return to the order block area. Hold that, and the bullish read stays intact across all three timeframes at once.
Lose $112 with real conviction, though, and the four-hour order block comes into play next. $107 to $109.50 is the deeper retest zone below that. A daily close back under $108 would put the entire June trendline in real danger.
None of this is financial advice, only a read of where liquidity and structure currently sit. Coinbase opening IPO access to retail traders this week added to a broader risk-on mood across crypto markets. That backdrop matters almost as much as the chart itself. Setups like this can invalidate fast, and the levels above matter more than any single prediction.





Leave feedback about this