

Ethereum price faces $2,000 support as exchange withdrawals surge to the highest level since November, indicating potential shifts in market supply and momentum.
Summary
- Ethereum trades at $2,001, down 4.3% in the last 24 hours.
- Exchange withdrawals hit 31.6M ETH in February, highest since November.
- $2,000 support is critical; break below risks $1,850, upside targets $2,300–$2,400.
Ethereum (ETH) is trading at $2,001 at press time, down 4.3% in the past 24 hours. The seven-day range stands between $1,841 and $2,099. ETH is still up 7.7% over the past week but down 14% in the last 30 days.
From its August 2025 all-time high of $4,946, the price has retraced about 59%. Spot trading volume reached $25 billion in the past 24 hours, a 21% drop in the last day.
Data from CoinGlass shows a cooling in the derivatives market. Trading volume has slipped 7.8% to $59 billion, and open interest has declined 5.6% to $25 billion.
As ETH approaches a critical price zone, many traders appear to be trimming positions and lowering risk.
Exchange withdrawals surge
At the same time, on-chain activity tells a different story. According to a March 3 report by CryptoQuant contributor Arab Chain, February recorded nearly 31.6 million ETH in exchange withdrawals, the largest monthly outflow since November.
A significant portion of that came from Binance, where about 14.45 million ETH was moved off the platform. About 1.04 million ETH were withdrawn from Kraken and approximately 3.83 million ETH were removed from OKX.
Large withdrawals from exchanges usually mean the assets are being moved into cold storage or set aside for longer-term holding. Once tokens leave trading platforms, there’s less supply readily available, which can ease immediate selling pressure.
This kind of shift often suggests that investors are choosing to hold onto their positions or adjust their strategy during periods of market volatility.
Ethereum price technical analysis
The $2,000 level carries both psychological and structural importance. Because that price level coincides with an important technical area on the chart and has psychological weight for investors, both bulls and bears are pay close attention to it.
Buyers have stepped in on dips, but support is under pressure. A daily close below $1,950 would expose the $1,850–$1,900 area, where prior liquidity sits. Below that, $1,700 becomes a deeper downside target.
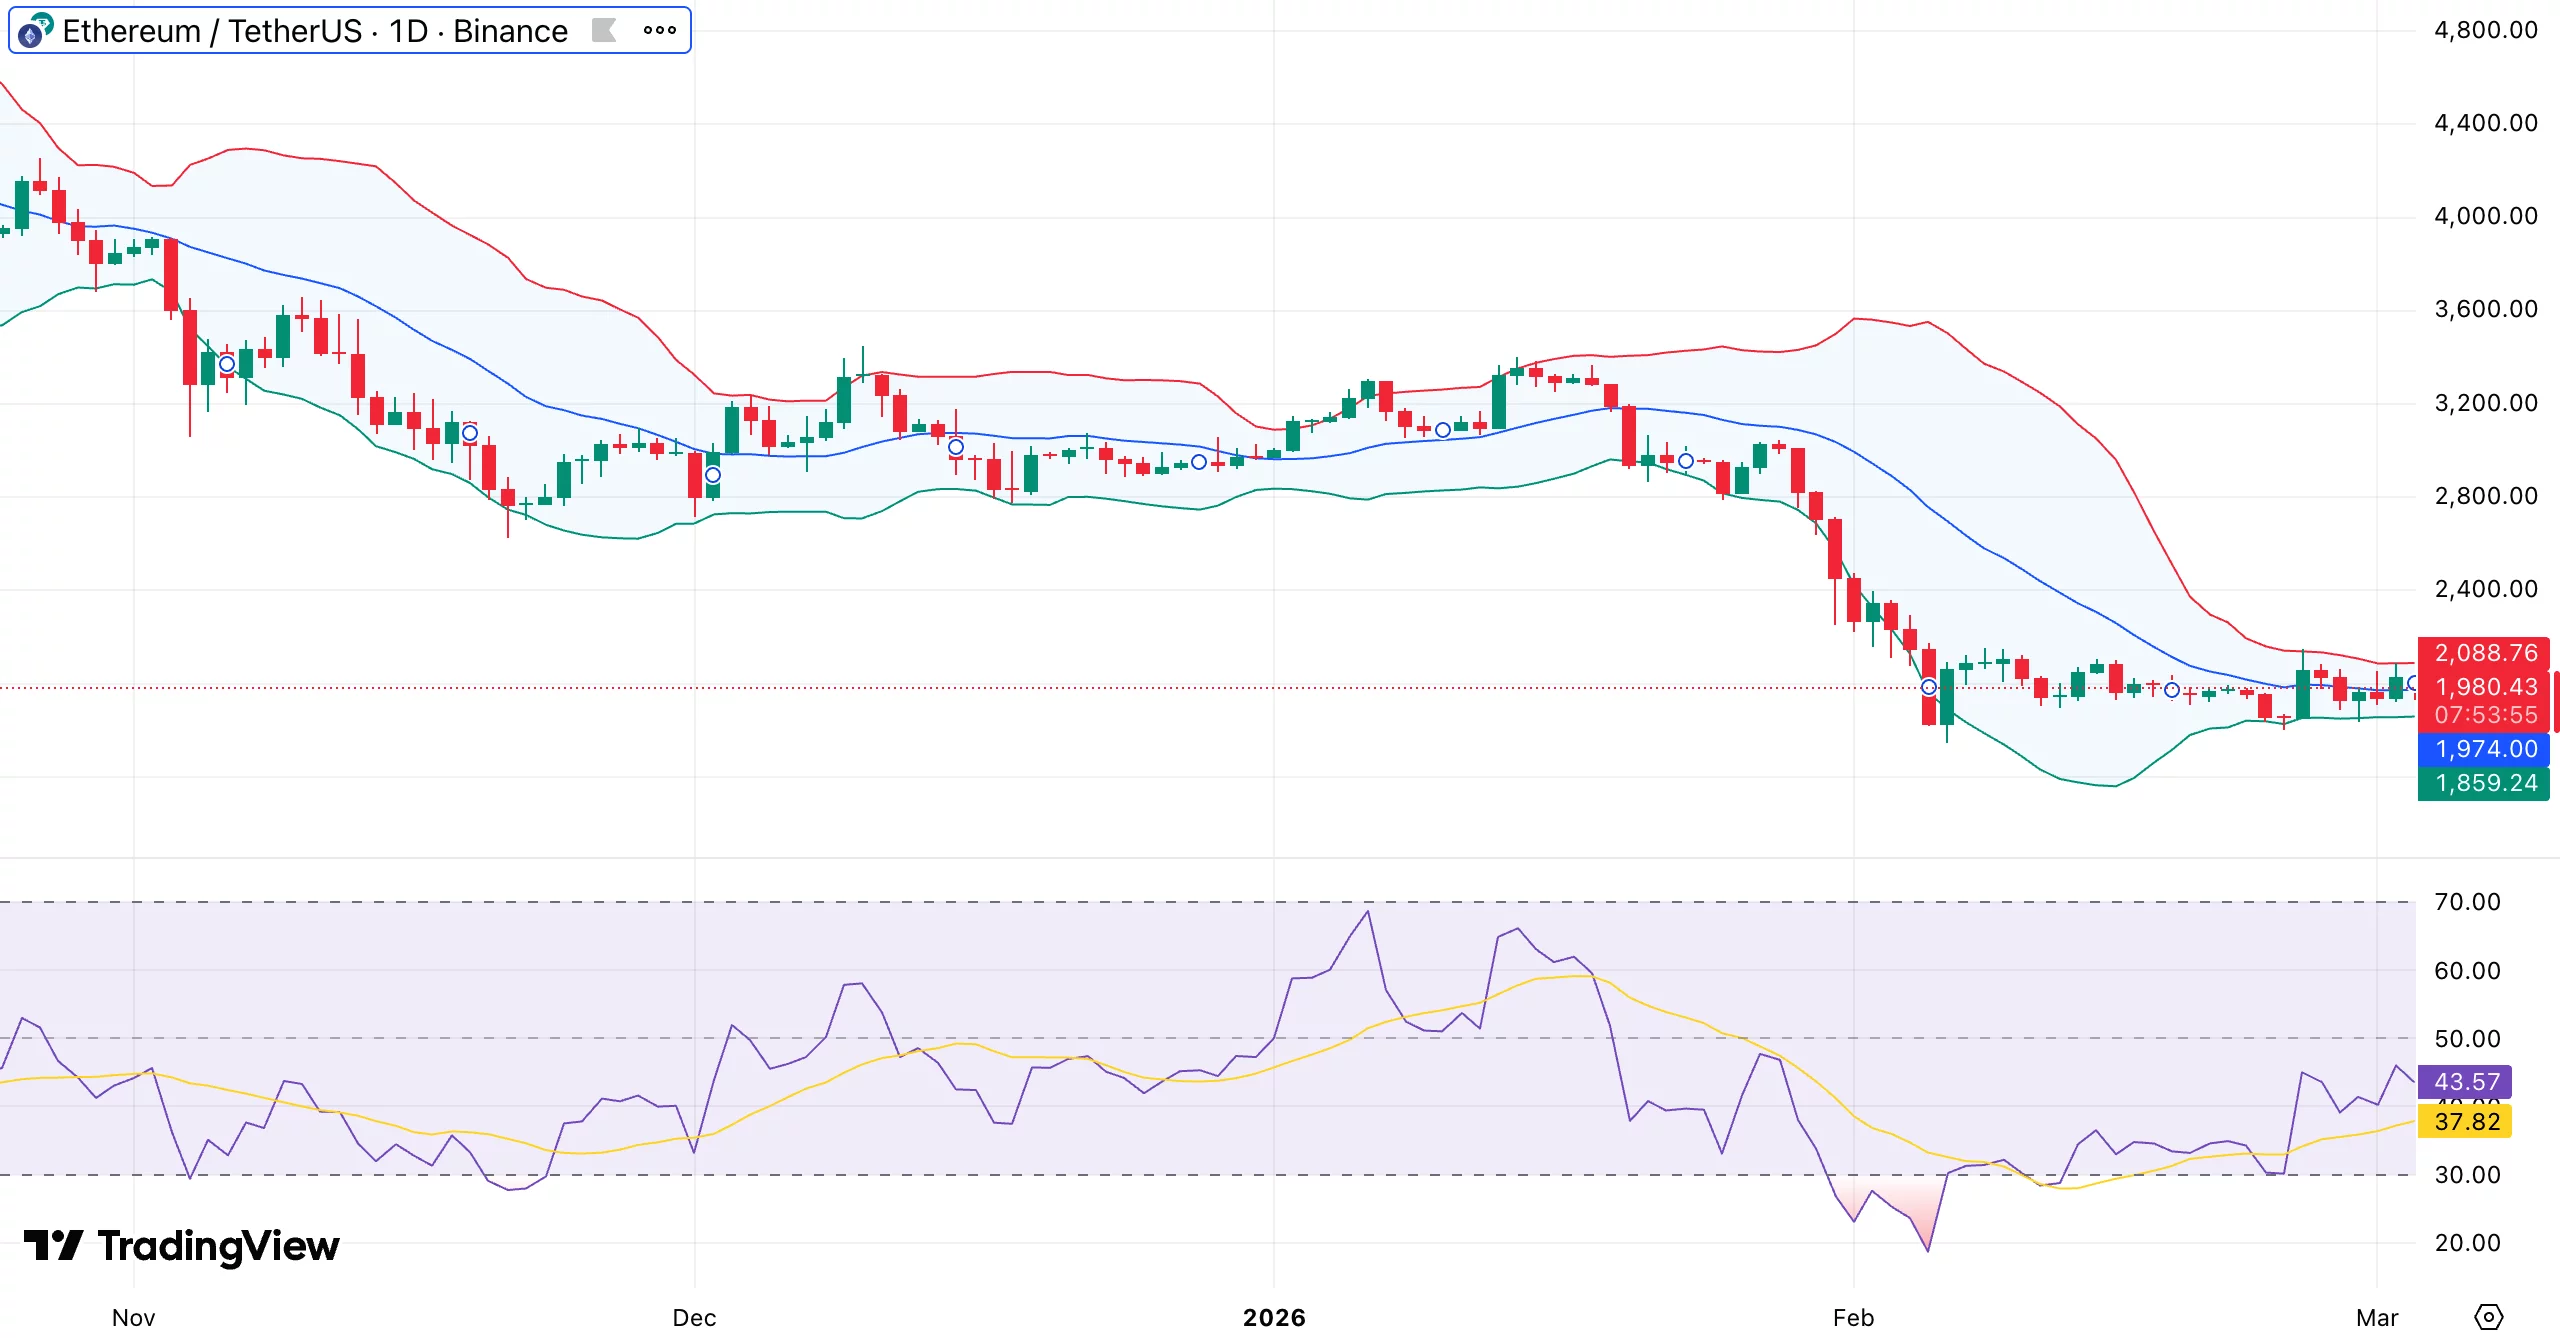
ETH recently moved down to the lower Bollinger Band, a level that often suggests the asset may be oversold in the short term. At the same time, the bands have begun to tighten, a pattern that usually precedes a more significant price movement in either direction.
A recovery toward the middle band in the $2,050 to $2,100 range may occur if buyers are able to hold the $2,000 level. The relative strength index has rebounded from near 30 and is attempting to recover. A push above 45–50 would show improving momentum.
Until then, the broader pattern of lower highs stays intact. ETH remains below its 50-day moving average, and a move above $2,150–$2,200 would be needed to shift short-term structure.
If ETH holds above $2,000 and breaks $2,150 with stronger momentum, upside targets sit near $2,300 and $2,400. If $2,000 fails on a daily close, the path toward $1,850 opens quickly. The next few sessions will likely decide whether ETH stabilizes or enters another leg lower.


Leave feedback about this