

Ethereum price rose 7% to a three-week high on Wednesday, fueled by a broader market rebound and strengthening stablecoin supply on the network.
Summary
- Ethereum rose to a three-week high of $2,257 as a US-Iran ceasefire eased tensions and boosted risk appetite.
- Stablecoin supply on Ethereum hit a record $180 billion, reinforcing liquidity and network activity.
- Bullish technical signals remain intact, with $2,384 as the next resistance and $2,500 in focus.
According to data from crypto.news, Ethereum (ETH) price rose 9% to a multi-week high of $2,257 on Wednesday, fueled by a recovery in the entire crypto market following news that the U.S. and Iran have agreed to a two-week ceasefire to their war, while also opening the Strait of Hormuz within the period. The two nations would also be discussing a framework for a permanent end to the war.
As tendons eased, crude oil prices fell back under $100 after several days. This reduced investor concerns of runaway inflation while boosting investor appetite for risk assets, which led to the Ethereum rebound today.
Alongside the macro tailwinds, on-chain data points to strengthening fundamentals within the Ethereum ecosystem. The total value of stablecoins issued on the network has reached a record $180 billion, according to blockchain analytics firm Token Terminal.
Ethereum now accounts for close to 60% of the global stablecoin supply, a figure that has increased 150% over the past three years, the firm said in a recent report.
Stablecoins are widely considered the backbone of decentralized finance. Hence, a surge in stablecoin supply automatically implies an increase in overall network activity.
This surge in activity could position Ethereum as a leading settlement layer for stablecoins and draw in more retail and institutional interest.
On the daily chart, Ethereum price has been trading above an ascending trendline support it has respected since early February this year. Each time the token’s price slipped around to this critical level, bulls stepped in to buy the dip and push the price back up.
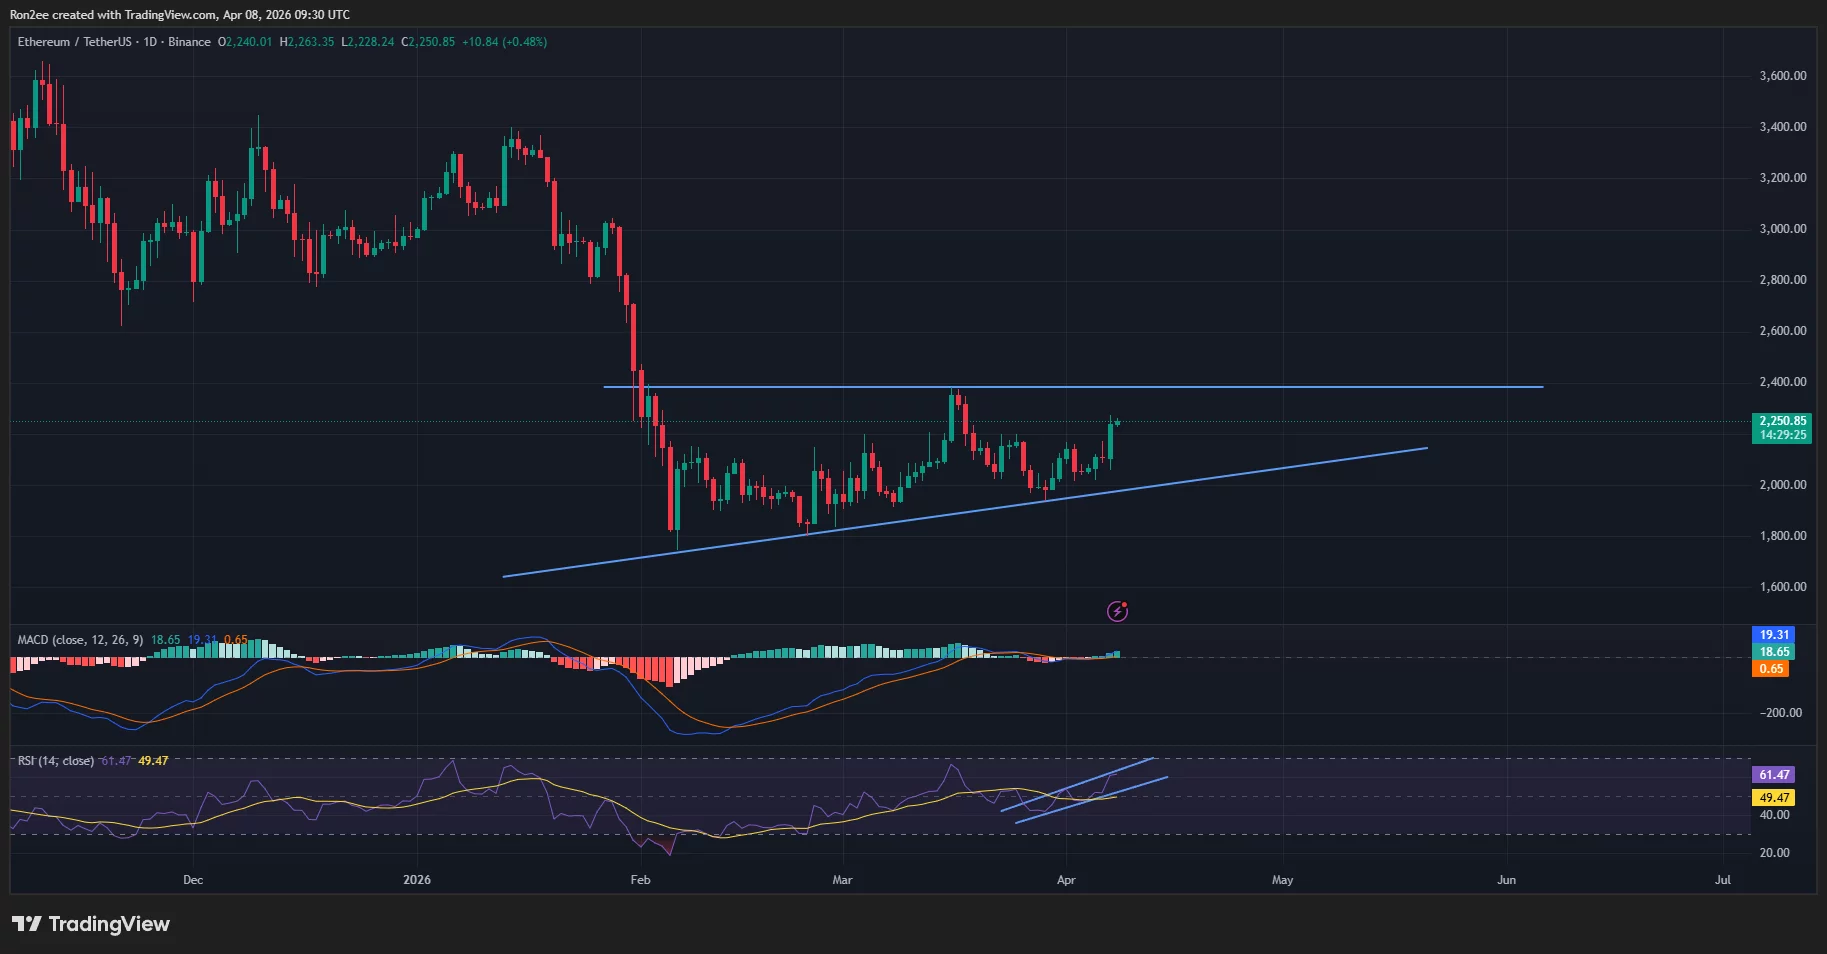
A look at technical indicators such as the MACD and RSI also provides a more grounded perspective of the token maintaining its leg higher in the coming sessions.
Notably, the MACD lines have pointed upwards and crossed the zero line, a sign that bullish momentum is gaining strength. Additionally, the RSI has also been in an uptrend, forming an ascending channel, which means the token is increasingly overbought but remains in a strong recovery phase.
For now, $2,384 acts as the next key resistance level to clear. A decisive breakout above this point with strong volume could pave the way for a rally toward the $2,500 psychological barrier.
On the contrary, if Ethereum price slips back below $2,200, it could revisit the $2,100 support zone where the long-term trendline currently sits.
Disclosure: This article does not represent investment advice. The content and materials featured on this page are for educational purposes only.


Leave feedback about this