

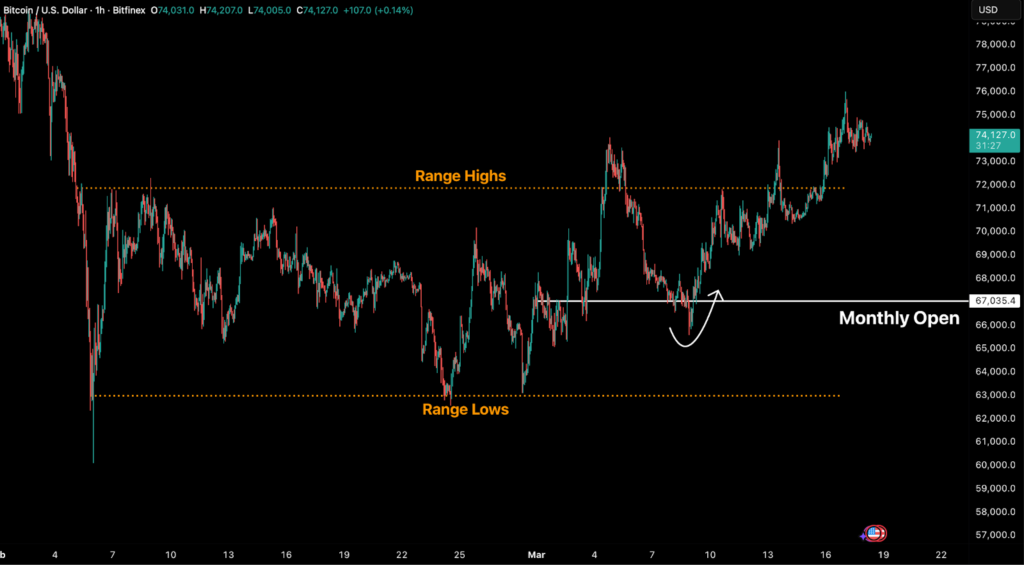
The successful retest of the Monthly Open on March 8th was an early sign that strength was beginning to return to bitcoin markets, after over four months of persistent weakness. This was also borne out by strong exchange-traded fund (ETF) flows and a shift in spot dynamics that allowed price to hold a key psychological level before breaking above local range highs.
Bitcoin’s climb from the $71,000–$72,000 range to $75,000 over 72 hours stems from three converging catalysts. The primary driver was landmark joint guidance issued by the Securities and Exchange Commission (SEC) and Commodity Futures Trading Commission (CFTC) on 17 March, which formally classified digital commodities and stablecoins as non-securities. That regulatory clarity was reinforced by five consecutive days of inflows (since 11 March) into US spot ETFs, contributing over $700 million to the monthly total. A partial de-escalation in geopolitical risk also followed, as Iran confirmed passage exceptions for Indian-flagged liquefied natural gas (LNG) vessels through the Strait of Hormuz.
The context is significant here. Bitcoin’s rally occurred while the S&P 500 registered its lowest level since November 2025, WTI crude sat at $98.71, Brent at $103.14, and the US 10-year yield held at 4.14 percent. The price action doesn’t fit a general risk-on narrative; it suggests either a nascent decoupling or a temporary supply squeeze within the cryptocurrency asset itself.
The $75,000–$78,000 zone remains a structural supply ceiling. We’re now around the cost basis for many short-term holder (STH) cohorts, which the STH Spent Output Profit Ratio (SOPR) reflects, with investors exiting close to breakeven on the bounce. Spot market demand is, however, aggressive. The cumulative volume delta (CVD) across all exchanges is currently outpacing static supply and resting asks.
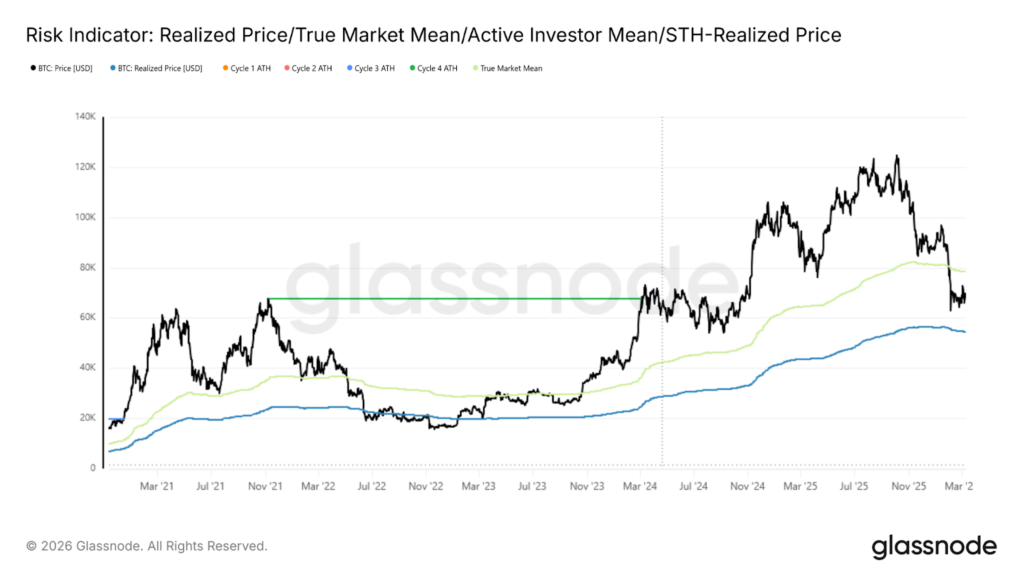
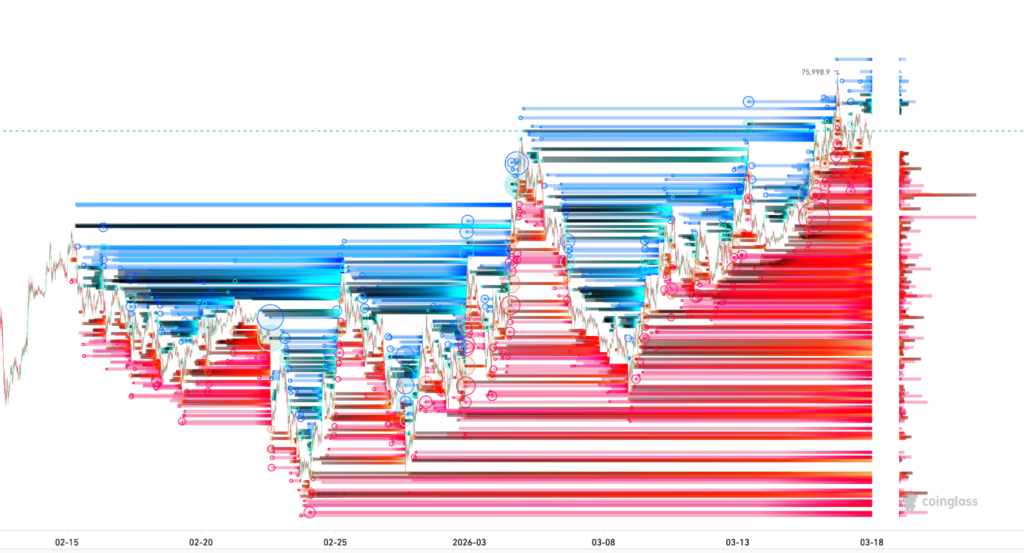
True Market Mean sits at $77,700, meaning a large cohort of short-term holders are near breakeven at this level, which creates sell-side resistance on any approach. The liquidation heatmap (see below) reinforces the asymmetry: the largest high-leverage liquidation clusters sit below $72,000. A correction to that level would cascade heavily leveraged longs. Above $75,000, short positions carry medium-to-low leverage, making for a less compressed spring.
The current open interest (OI) structure complicates a straightforward bullish reading. Total BTC open interest has risen to $50.30 billion, up 14 percent from the multi-year lows reported in previous Bitfinex Alpha reports.
Despite rising price, the aggregate long/short ratio is narrowly net short at 49.69 percent long versus 50.31 percent short, with a negative annualised funding rate of -3.72 percent. The OI being added is primarily bears establishing perpetual exposure against the price ascent, not fresh bullish bets.
Volatility is compressing as traders avoid aggressive positioning ahead of macro events. That creates the conditions for a sharp move in either direction, driven by two competing forces:
- Aggressive Spot Demand: Narrow cohorts are exhibiting robust spot demand. Even a temporary deceleration in that buying pressure could precipitate a sharp pullback.
- Rigid Short Positioning: Bears are maintaining exposure, paying notable premiums via perpetual funding and put pricing to hold hedges or naked short positions.
That structural dynamic creates a precarious situation for short sellers. A sustained wave of aggressive taker demand could trigger cascading liquidations and forced buying, particularly given the relative illiquidity of spot markets versus perpetuals. The market is primed for a significant move; direction remains finely balanced.
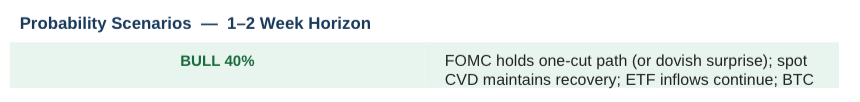
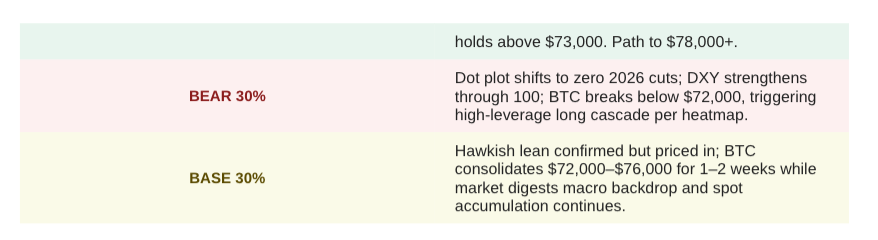
The gating variable is the Federal Open Market Committee (FOMC) dot plot released today. A reduction to zero cuts projected for 2026 would reinforce the 4.14 percent 10-year yield and US Dollar Index (DXY) strength near 99.50, removing the macro tailwind needed for a sustained break above $78,000. A dovish surprise, specifically explicit acknowledgement of the oil-driven growth shock, would provide the spot catalyst this positioning structure is waiting for.


Leave feedback about this