

Bitcoin price stabilized above $76,000 after buyers defended the $75,000 area, while improving 4-hour momentum and nearby liquidity at $77,000 pointed to a possible short-term rebound.
Summary
- Bitcoin recovered to $76,362 after falling toward $75,000 during the latest sell-off.
- The daily price remains below the Bollinger Band midpoint at $78,028.
- 4-hour MACD momentum improved, but the Supertrend stays bearish below $78,597.
- Liquidation clusters near $77,000, $78,000, and $80,000 could attract price during a rebound.
Bitcoin price action today
According to data from crypto.news, Bitcoin (BTC) price was trading near $76,362 at the time of writing, up about 0.2% on the day after moving between $76,055 and $76,774. The latest session followed a decline that briefly pushed the asset below $75,000 before buyers stepped in.
The rebound came after the Federal Reserve delivered its first interest-rate increase in three years. The central bank raised its benchmark range by 25 basis points to 3.75%–4.00%, while projections showed 16 of 18 officials expected at least one more increase before the end of 2026.
The rate decision had largely been priced into markets, helping Bitcoin avoid another sharp decline during Fed Chair Kevin Warsh’s press conference. Bitcoin instead protected the $75,000 area and began consolidating between roughly $75,000 and $77,000.
Earlier selling followed the U.S. Senate’s failure to advance the CLARITY Act. The procedural vote ended 49–50, leaving the bill 11 votes short of the 60 required to begin debate. The proposal sought to divide digital asset oversight between the Securities and Exchange Commission and the Commodity Futures Trading Commission.
Fed decision leaves Bitcoin below daily resistance
The daily chart shows that Bitcoin remains in a weaker position despite holding above $75,000. The price trades below the Bollinger Band midpoint at $78,028, which now acts as the first major technical barrier.
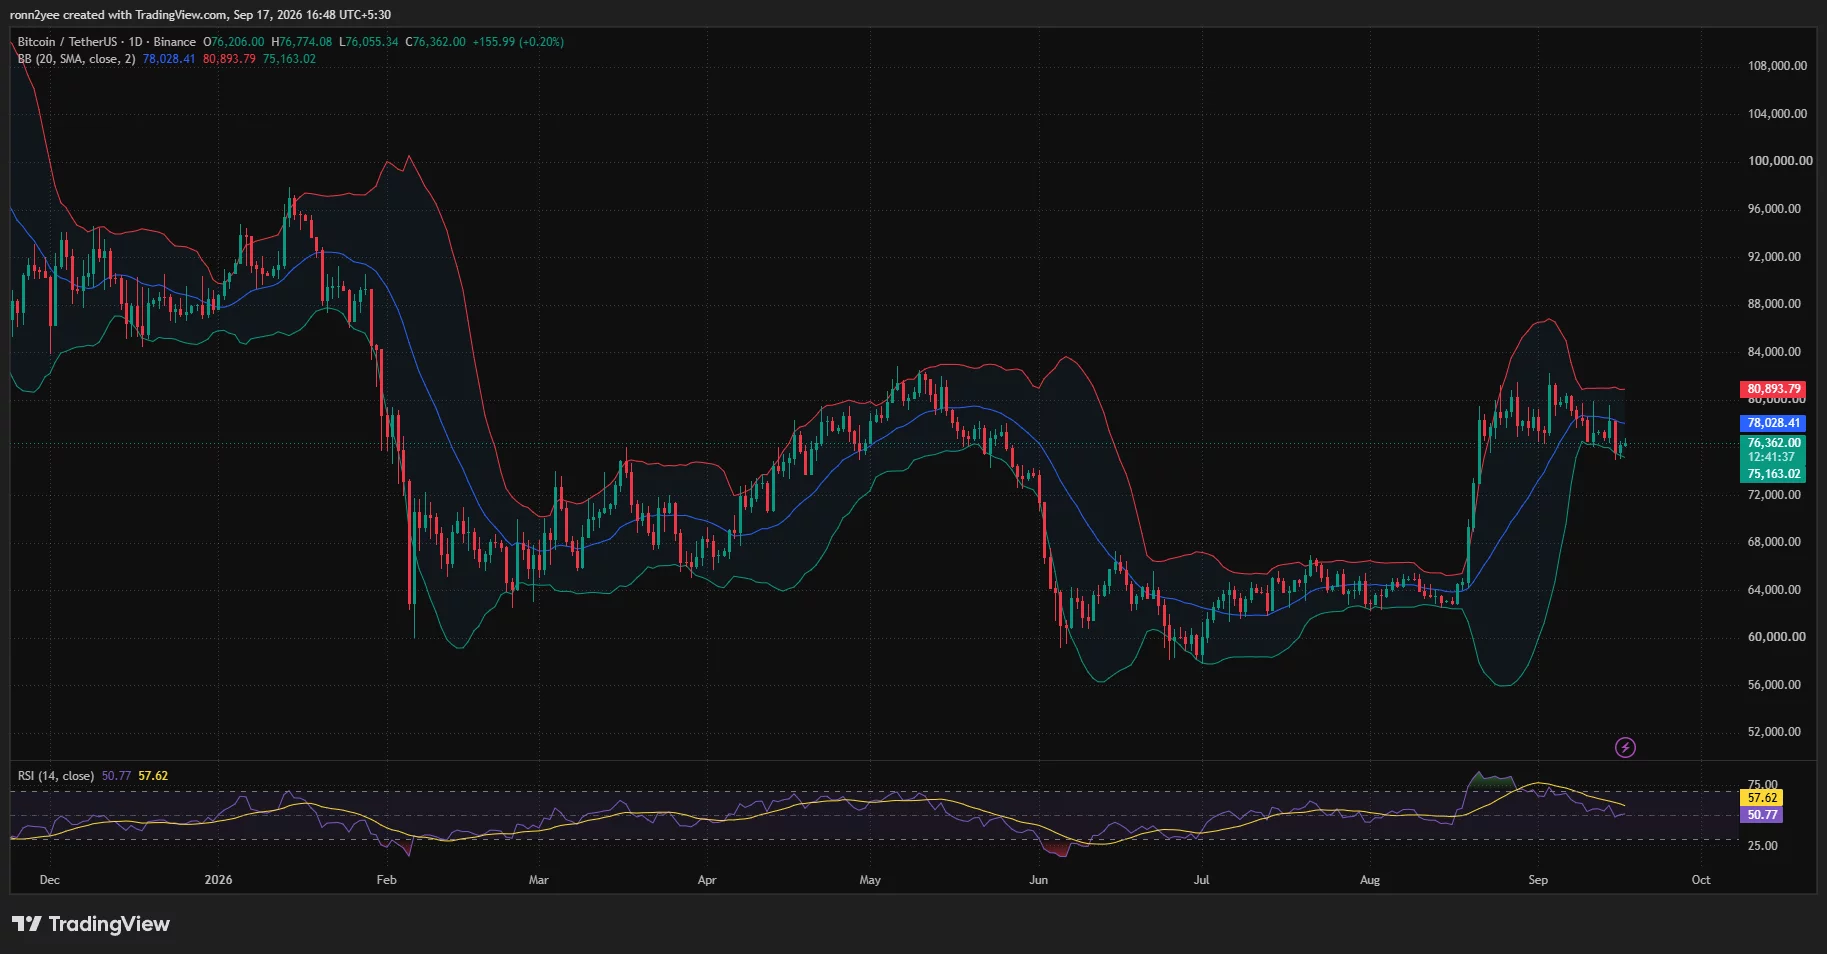
Bitcoin is also close to the lower Bollinger Band at $75,163. The recent test of this area attracted buyers, but another daily close below it could expose the market to a deeper correction. The upper band stands near $80,894, placing it close to the wider resistance area that capped rebounds earlier in September.
Daily relative strength index readings provide a mixed signal. The RSI stands at 50.77, close to the neutral 50 level, while its moving average remains higher at 57.62. Momentum has cooled from overbought conditions reached after Bitcoin’s late-August rally, but the indicator has not yet fallen into oversold territory.
The setup suggests that Bitcoin is consolidating rather than confirming a sustained recovery. A move above the Bollinger midpoint would improve the short-term structure, while a break under $75,000 would give sellers control again.
4-hour momentum points to a possible rebound
Bitcoin’s 4-hour chart shows early signs that selling pressure is easing. The MACD histogram has moved slightly positive at 23.88, while the MACD line stands at minus 353.28 and the signal line at minus 377.16.
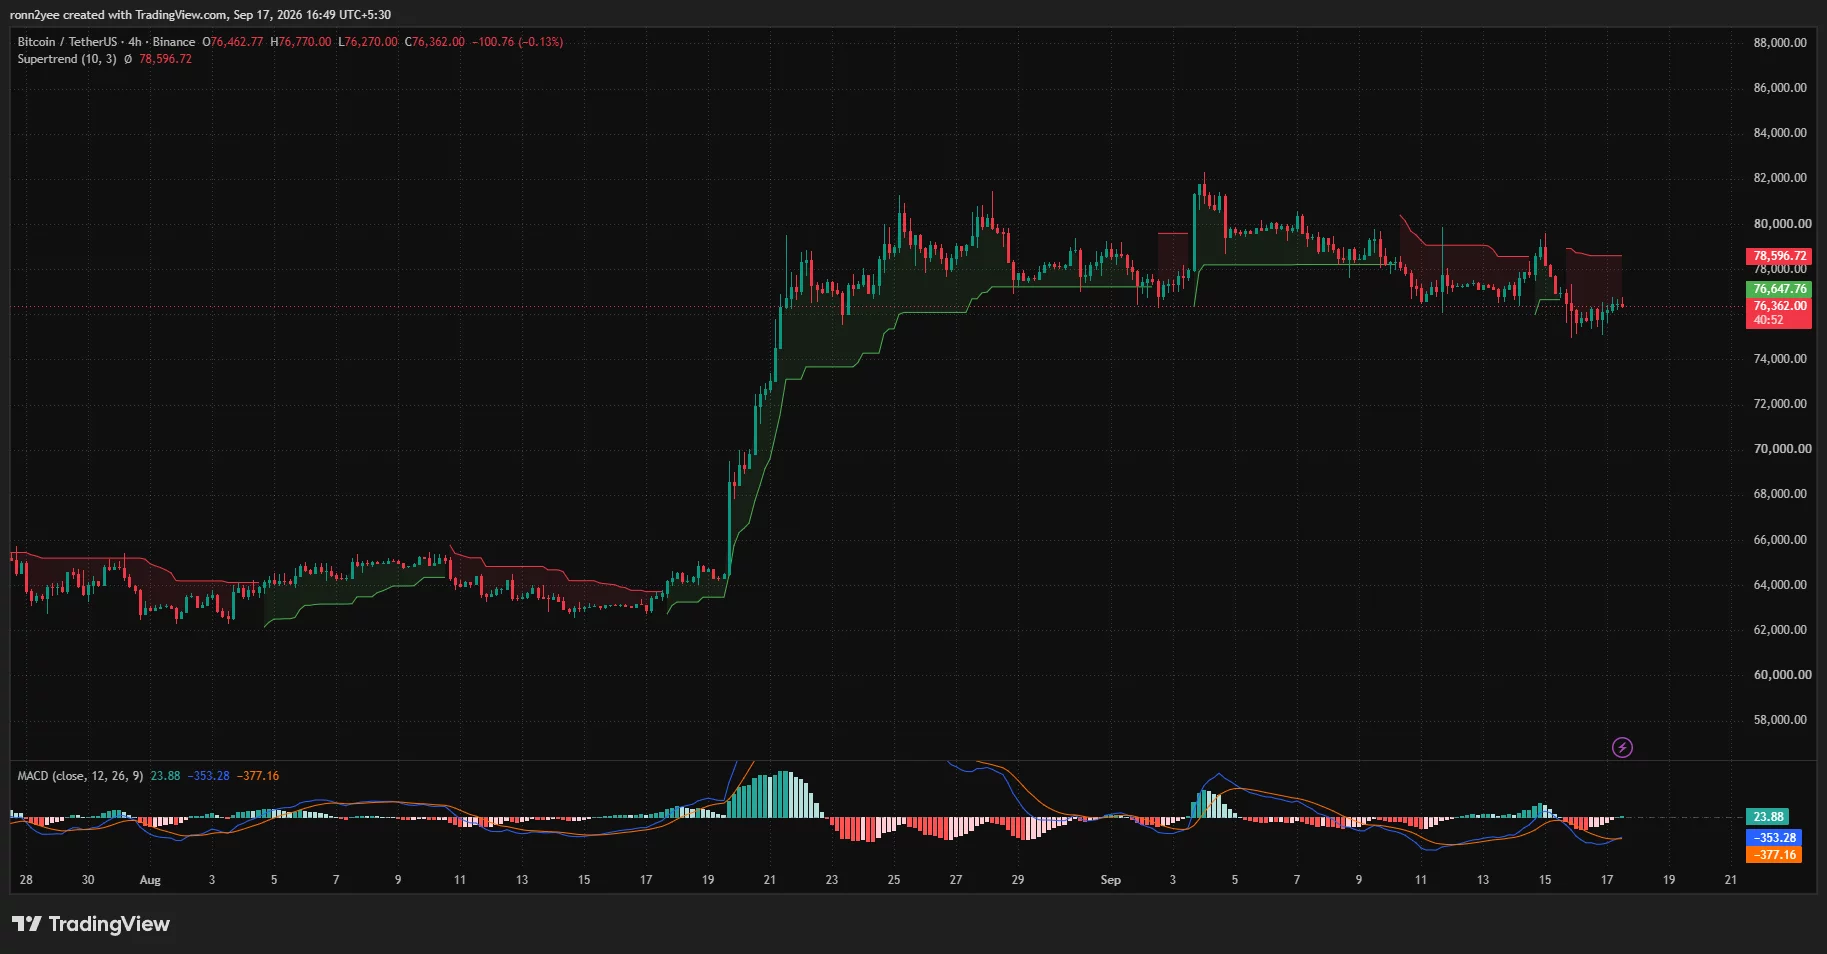
The crossover shows that short-term momentum is beginning to improve, although both lines remain below zero. Bitcoin would need continued buying to turn the signal into a broader bullish reversal.
The 4-hour Supertrend remains bearish at $78,596.72. Price also sits just below a nearby technical level around $76,648, making the $76,650–$77,000 zone the first barrier for buyers.
A close above that range could allow Bitcoin to test $77,300, followed by the Supertrend near $78,600. Failure to clear $77,000 would keep the price vulnerable to another test of $75,000.
Liquidation levels place $77K in focus
The three-day CoinGlass liquidation heatmap shows a dense band of leveraged positions near $76,800–$77,000. Another larger concentration sits between approximately $77,500 and $78,000.
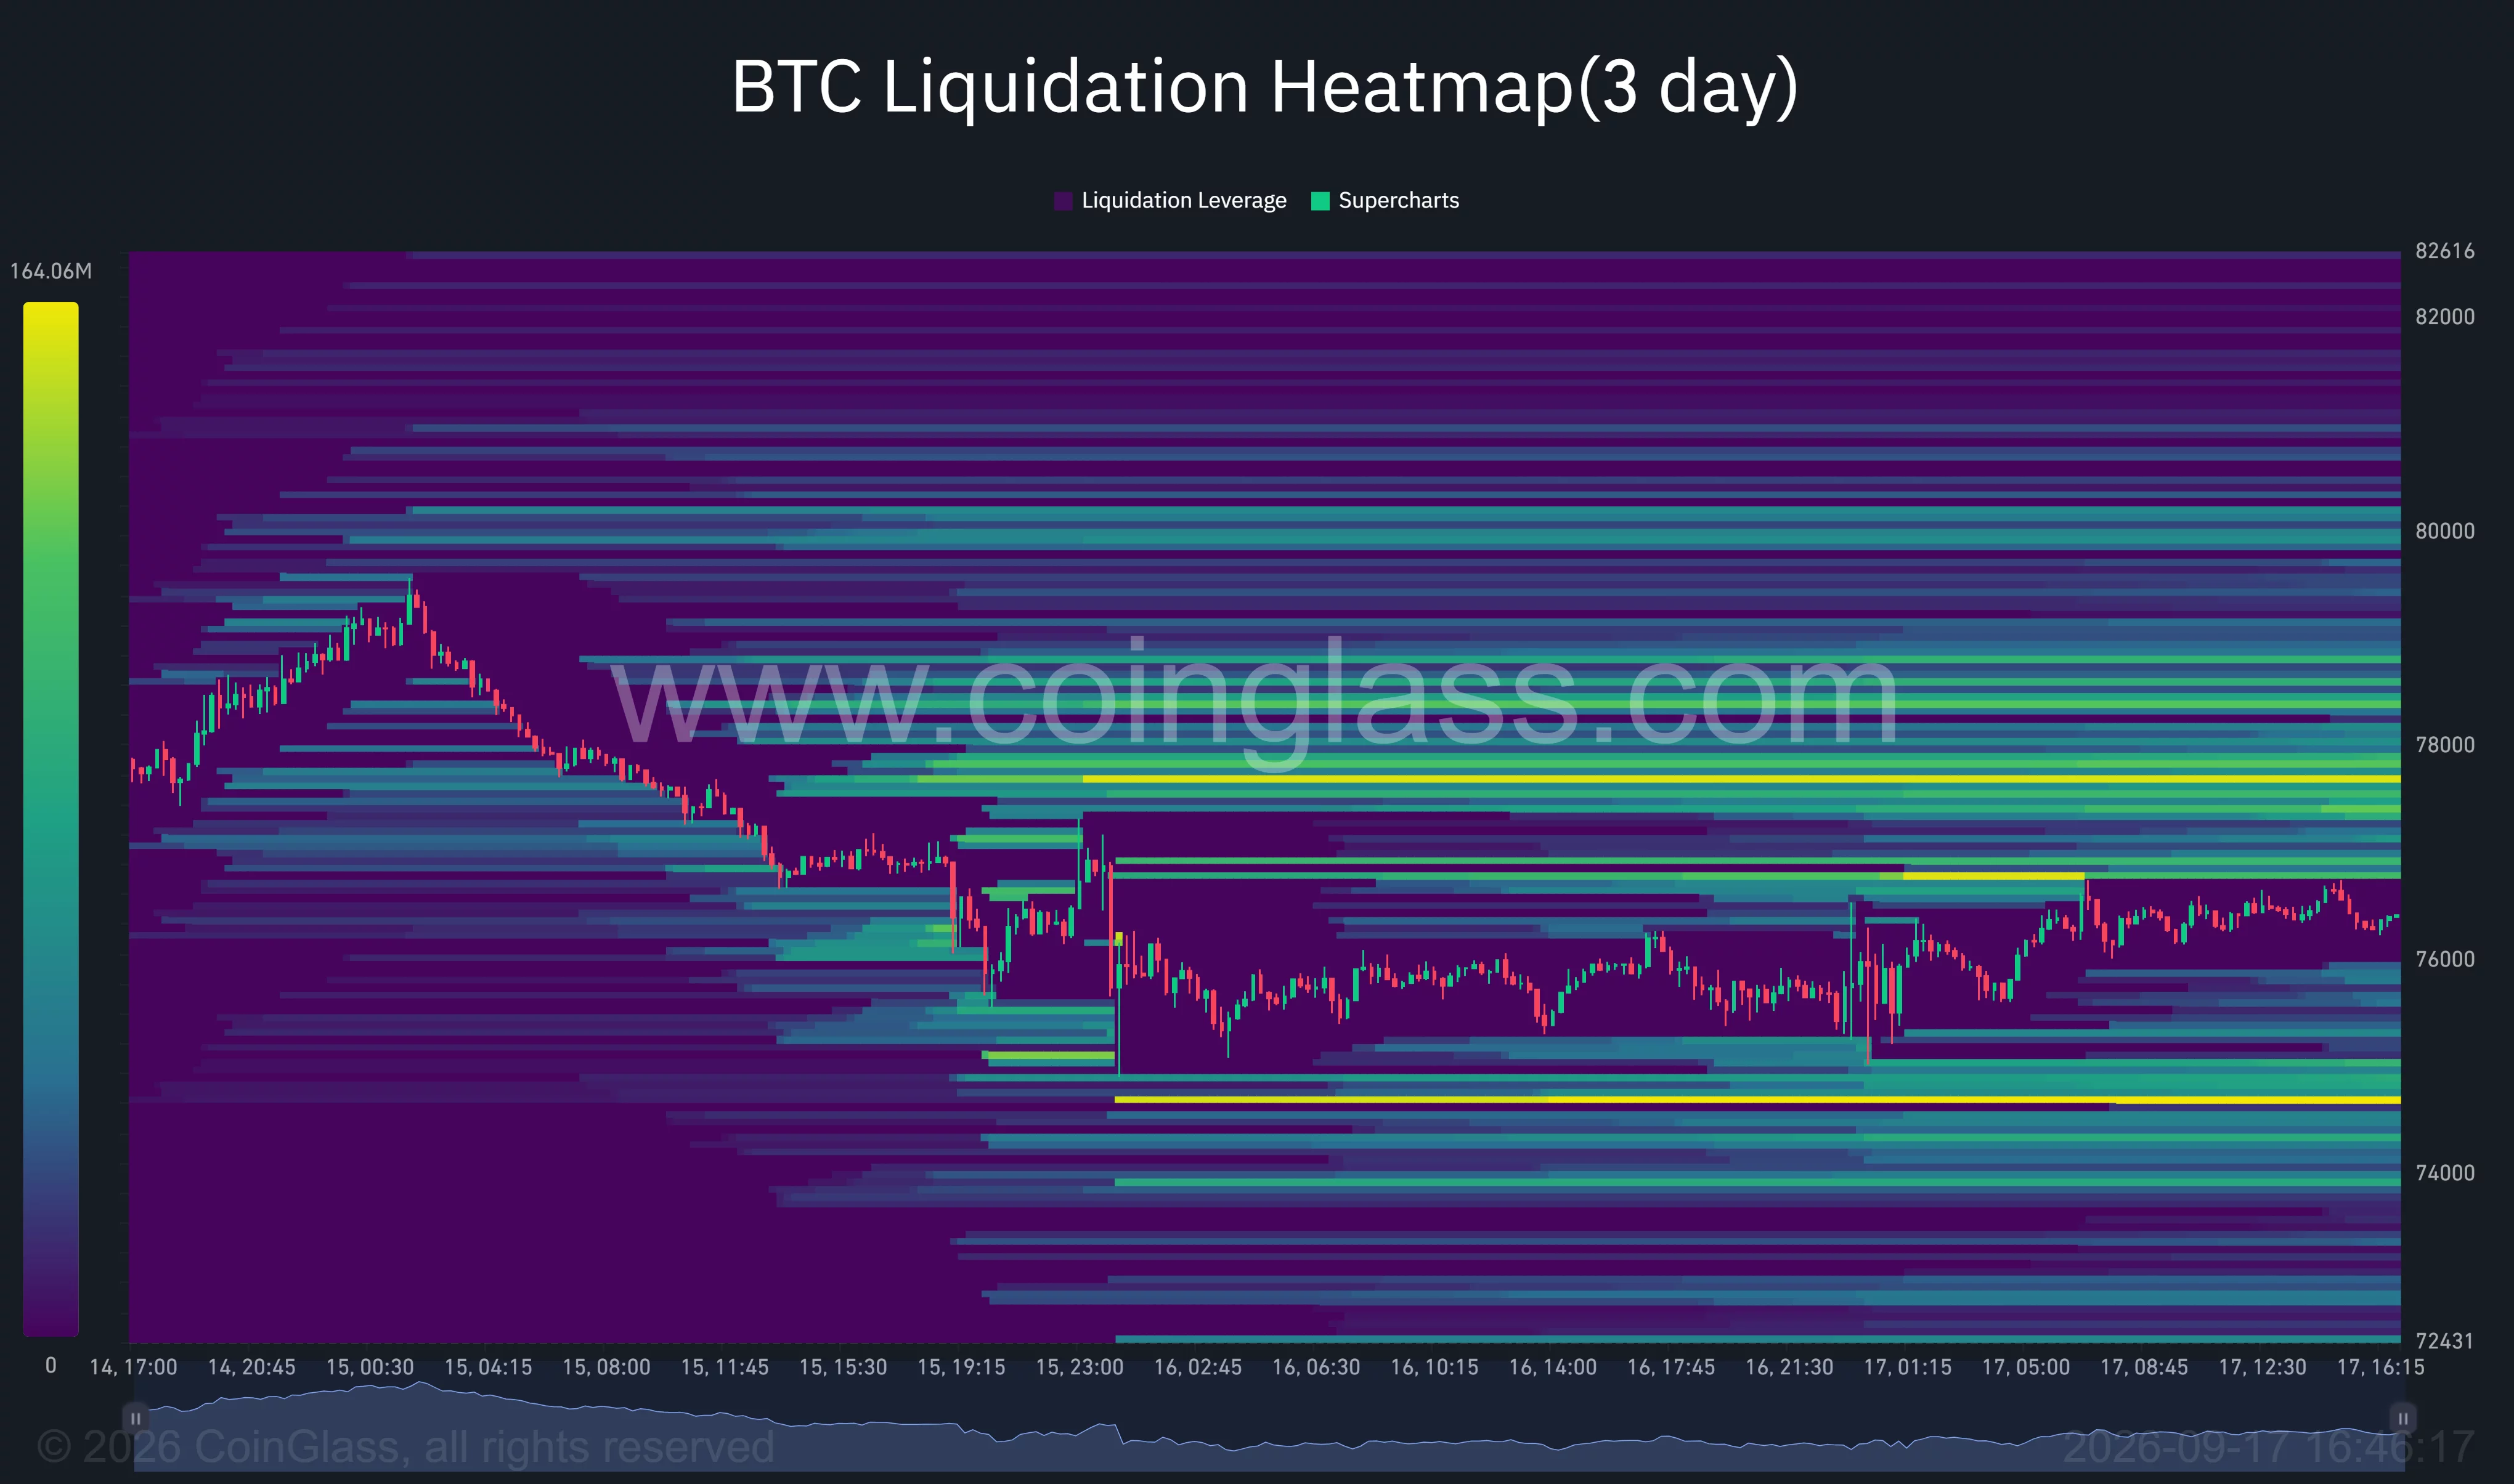
Liquidity becomes heavier around $80,000, with additional clusters extending toward $82,000. Traders often monitor such areas because forced position closures can accelerate a move once price enters a dense liquidation zone.
Crypto trader Daan Crypto Trades said Bitcoin had already removed most of the liquidity below the market when it swept the August lows. He identified $80,000 and $82,000 as the largest remaining clusters within the wider range.
“The big clusters that are left in this range sit at $80K & $82K,” he said.
Those targets remain distant while Bitcoin trades around $76,000. A recovery through $77,000 and $78,600 would be needed before the upper liquidity zones become immediate targets. On the downside, the heatmap shows another strong band close to $74,700–$75,000, making that region a possible target if the current rebound fails.
Analysts watch $77.3K as the next trigger
Crypto analyst Lennaert Snyder said Bitcoin’s ability to defend $75,000 during the Fed decision supported a possible long setup. He added that recent declines had attracted short positions, creating conditions for a squeeze if the market moves higher.
“I’m looking to scalp-long towards the 77.3K POC first, reclaiming that is the next bullish trigger that opens the door to my next targets up to the extremes at 78.5K,” Snyder said.
Snyder identified $74,500 as an alternative support area if Bitcoin makes another downward sweep. A loss of that region would weaken the rebound case and bring the short-term holder cost basis near $71,300 into focus.
The immediate structure therefore depends on whether buyers can reclaim $77,300. A move above that level would open a path toward $78,000–$78,600, while a 4-hour close above the Supertrend could support a broader recovery toward $80,000.
A rejection below $77,000 would keep $75,000 exposed. Losing that psychological level could trigger another liquidity sweep toward $74,500, with $71,300 becoming the larger downside level if selling accelerates.
Disclosure: This article does not represent investment advice. The content and materials featured on this page are for educational purposes only.






Leave feedback about this