
| Level | Value | Read |
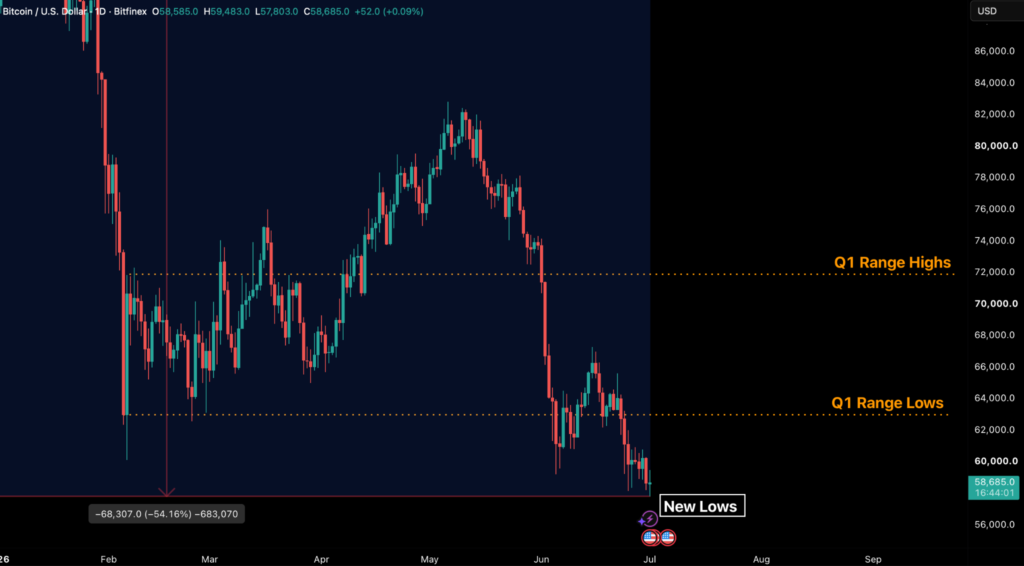
| Cycle low | $58,000 (25 June) | Retested 30 June, held by $56 |
| Weekly Open | $59,590 (29 June) | Spot trades below it |
| $60,000 shelf | Reclaimed, rejected | Support flipped to resistance |
| Gamma flip | ~$68,000 | Negative-gamma regime below |
| Aggregate realised price | ~$53,000 | Capitulation line, ~8% below spot |
| Monthly Open | $71,314 (1 June) | June closed ~18% lower |
The clearest signal this week is what did not drive the move. Treasury yields fell, not rose: the 2-year eased from 4.24 to 4.1 percent and the 10-year from 4.51 to 4.38 percent between 22 and 29 June. Equities printed record highs, with the S&P 500 closing the quarter at 7,449, up 9.55 percent for the year and posting the best second quarter for US indices since 2020. The dollar stayed firm, the DXY near 101.2 after touching a 14-month high of 101.8 on 24 June, while gold slipped to $3,974 currently, down roughly 10 percent for June.

Softer yields and record equities performance are ordinarily a supportive backdrop for bitcoin. Instead BTC fell back to retest $58,000. Falling yields alongside a falling BTC is now the fourth such occurrence this cycle, and the pattern is consistent each time this happens: despite a macro tailwind being present, BTC still declines. The sellers are mostly crypto-native, which explains the breakdown in any correlation with equity markets. This further breaks down the correlation with equity markets unless there is macro stress, when all risk assets tend to move in unison.
Bitcoin is not trading as a risk-on proxy here. It is burdened by mechanical sellers as prices move 54 percent below ATHs to make cycle lows at $57,803 to mark the Q3 open.
The 26 June quarterly expiry reset the options book but confirmed a sustained negative gamma regime rather than reversing it. This was the largest quarterly expiry of the year and the third largest in history at $10.6 billion in bitcoin and ether notional, roughly 80 percent of it out of the money eliminating close to 37 percent of global options open interest. At settlement, expiring out-of-the-money gamma vanished but the walls and flip re-formed around front-month strikes near spot. The reset did not rescue the tape.

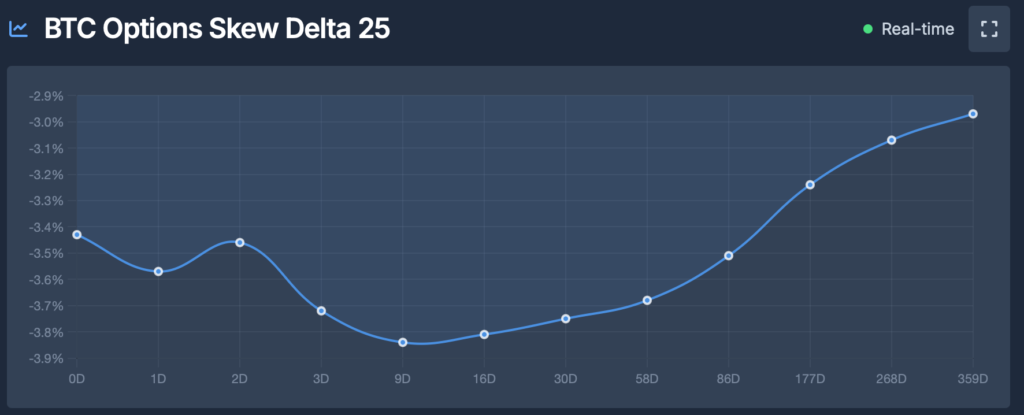
Post-expiry, BTC still trades below the gamma flip near $68,000. Below the flip, dealers are short gamma and hedge with the move which on the spot market tape translates to large entities buying strength or selling weakness amplifying volatility rather than damping it. The BTC 25-Delta Skew registers a put-dominant -5.20 percent against a call-skew of 1.50 percent. This print flags as Elevated Fear: put skew sits significantly above the historical mean, confirming a structural surge in downside protection demand across the book. This is the exact same pattern observed in late June which alleviated heading into expiry, but is now confirmed to be a regime rather than a temporary set-up that might change post a large expiry.
The max pain that sat at $72,000 to $74,000 into expiry has remained inert. Max pain only pins price when dealers are long gamma, and it has no gravity beneath the flip.
Funding is also neutral and currently sits at roughly 2.4 percent annualised, with longs paying shorts only modestly and nowhere near the 15 to 20 percent overheated threshold seen from 14 to 18 May, when the price moved past $80,000 on a relief rally. Open interest on perpetuals and futures held around $45 billion, down about one percent over the past week, and no fresh leverage has been built, with most of the deleveraging seen in early June. With the lack of any crowded long-tail consensus positioning in the market, we typically see slower but constant declines instead of volatile moves down.
Capital flight from institutional vehicles intensified over the past two weeks. The seven-day rolling average for US Spot ETF net flows plummeted to nearly -$300 million per day, establishing a streak of redemptions that ranks among the most sustained since the product’s inception. This relentless exit of capital signals a defensive pivot from traditional market participants, even as BTC has lost the $60,000 range lows, suggesting that current price levels have yet to stimulate a meaningful reversal in institutional sentiment. Even more cause for concern is that redemptions are led by the IBIT and FBTC ETFs, which were the strongest ETF buyers, even in times of major pullbacks (in contrast to GBTC, which represents legacy holders rather than new capital over the past two years.)

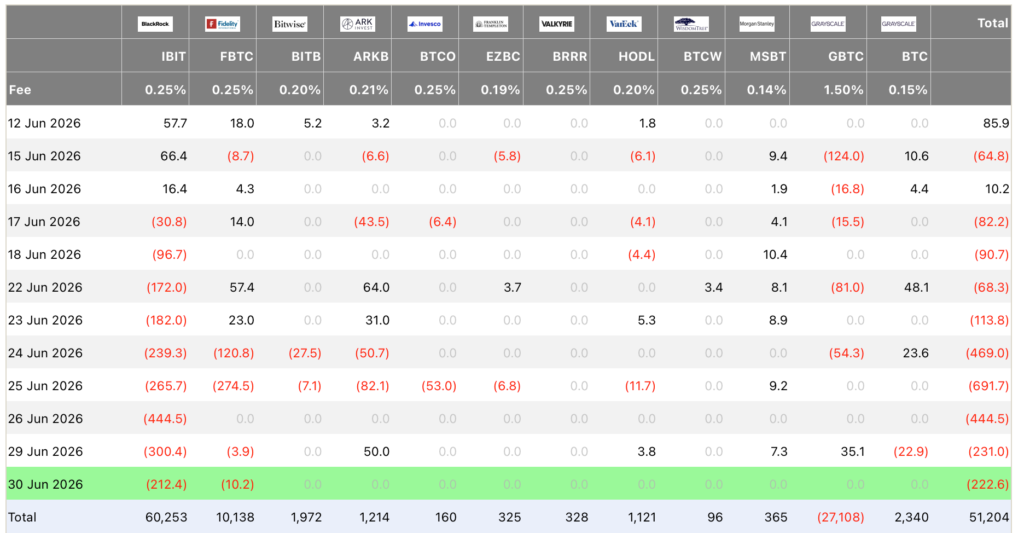
Spot ETFs posted a seventh consecutive negative week, the longest run since the January 2024 launch. The week to 26 June saw $1.79 billion of net redemptions, the second-worst on record. BlackRock’s IBIT accounted for about 73 percent of it; the average IBIT holder is now near 40 percent underwater.
The second seller in waiting is Strategy. On 29 June its board authorised the sale of up to $1.25 billion of Bitcoin to fund a US-dollar reserve and service obligations: a formal path from BTC holdings to cash. The STRC preferred dividend steps up to 12 percent from 11.5 percent for record dates on and after 1 July, raising the coupon the company must fund against roughly 847,363 BTC carried at about $75,650, near $17,000 per coin underwater. MSTR trades around 30 percent below the value of the Bitcoin it holds, its first sustained discount since accumulation began in 2020. The late-May sale of 32 BTC established that Strategy will liquidate to meet obligations; the $1.25 billion authorisation sets the ceiling on how far that can go.
We have noted on several occasions how the two key spot-buyer complexes (ETFs and treasury companies) had turned net sellers at the same time, and this is the crypto-native selling action we highlighted earlier, and which has led to a breakdown of traditional correlations. The move towards $58,000 on $1.79 billion of fresh outflows confirms neither has returned.
One structural consequence of the expiry matters most. The put wall that had anchored $60,000 rolled off at settlement. A rolled-off put wall means the floor must be re-established by fresh protection or by spot demand, and neither has appeared so far leading us to believe that the only “strong” support level for price is actually much lower at the realised price and there are not many other signals, other than what we can derive from orderflow and trader positioning.
With derivatives quiet, the on-chain cost-basis structure defines the downside.
The aggregate realised price, which is the average acquisition cost of all circulating supply, sits at about $53,000. Historically, this is the line past which an extended trade marks full capitulation; in prior bear phases, whenever the price spent time beneath it, those windows proved to be the deepest of the cycle. BTC at $58,000 is nearly nine percent above that level.
The cohort detail explains why the sell-off has been orderly rather than panicked. The Short-Term Holder Market Value to Realised Value ratio (STH-MVRV) is around 0.83, so the marginal cohort is underwater and taking losses, but not yet capitulating en masse. The Long-Term Holder Spent Output Profit Ratio (LTH-SOPR) on a 30-day basis is about 0.88, meaning the older cohort has now also begun spending at a loss. The cleansing has reached long-term holders; but it has not yet finished.

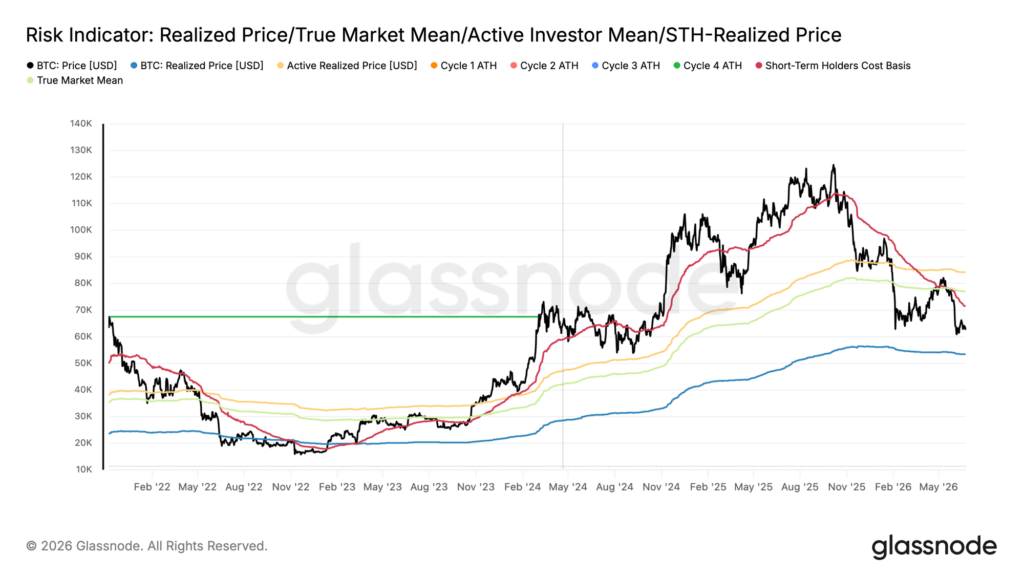
The structural counterweight remains intact. Exchange reserves are at a seven-year low near 2.21 million BTC, and long-term holder supply is at a record near 16.3 million. Coins are still leaving exchanges and ageing into patient hands as price falls, with no distribution footprint from that cohort. The Monthly Open of $71,314 from 1 June now sits some 18 percent above spot, confirming June as one of the worst months of the cycle, and the Weekly Open of $59,590 is overhead. The realised-price hold is the strongest structural argument the bull case has. It is support only till the mechanical sellers allow it to be.
- The $54,000 realised-price line: daily closes that approach it test whether it draws bids or gives way to the first extended sub-realised-price price move of the cycle.
- ETF flow direction: a genuine net-inflow week, not a single green day, is the first mechanical evidence the dominant seller has paused.
- Strategy execution: any filing disclosing sales under the $1.25 billion authorisation, and STRC trading relative to par into the 12 percent step-up.
- Perpetual open interest against price: whether OI rebuilds on the long side into any bounce, which is fragile, or the next leg arrives on fresh spot selling.