XRP compresses toward its symmetrical triangle apex. ChartNerdTA on X warns the range is running out of room with a violent move possibly weeks away.
Price is barely moving. That is the problem.
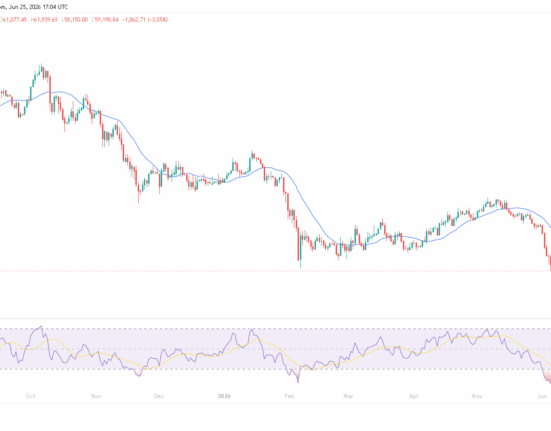
XRP has spent months locked inside a symmetrical triangle descending resistance pressing down from above, ascending support rising from below. Both lines are nearly touching. The chart shared by ChartNerdTA on X shows the apex circled in gray, sitting somewhere around the last days of May 2026. The clock is ticking, and the range gives less room every session that passes.
The longer the current $XRP compression phase persists, the closer we approach the apex toward the end of May, increasing the likelihood of a decisive resolution. The range continues. https://t.co/Zp6RmkwP85 pic.twitter.com/3C63p4nw6i
— 🇬🇧 ChartNerd 📊 (@ChartNerdTA) May 10, 2026
Source: ChartNerdTA
The XRP symmetrical triangle has been building since February, when price peaked near $1.60 and rejected. Since then, higher lows and lower highs. The pattern compresses market energy instead of releasing it. When it finally breaks, history says it tends to move fast and hard.
The Range That Refuses to Resolve
ChartNerdTA posted on X that XRP was “toying with us on which way this structure wants to break.” No confirmation. Price stays compressed, bouncing inside the range without a clean close on either side. The follow-up post made it clearer the longer this compression holds, the closer the market drifts toward the apex. Late May, per the chart, is when that indecision ends whether traders want it to or not.
Current price sits around $1.41. The descending resistance sits in the $1.48 to $1.52 band. A confirmed daily close above that level, backed by volume, opens a measured move toward the $1.80 to $2.00 range. That is the bullish case. The bearish path is a close beneath ascending support, somewhere near $1.30, which then opens a drop toward the $1.20 zone.
The prior trend before this triangle formed ran lower, not higher. ChartNerdTA flagged that detail. February highs near $1.60 were already rejected, and the structure entered compression from a downward bias. Statistically, that tilts the edge slightly toward bears though only slightly, and catalysts have a habit of flipping that math quickly, as noted in prior XRP Gaussian channel analysis.
Apex in Sight, No Move Yet
The gray circle on the chart marks the convergence zone. It sits at the end of May, which means traders have roughly two to three weeks before the pattern forces a resolution. A third scenario exists price chops sideways and reaches the apex without breaking either way. No catalyst. No volume. Just drift. Symmetrical triangles can do that. The breakout then gets delayed or muted.
Volume is the key variable. Any directional move that lacks volume expansion risks becoming a trap. Both bulls and bears have been burned by false moves inside this range already.
As ChartNerdTA noted on X, the longer compression persists toward the apex, the higher the likelihood of a decisive resolution. That resolution, when it comes, rarely arrives quietly.
Disclaimer: This article is based purely on technical analysis from cited sources and is not financial or investment advice. It is intended as news coverage only.