
Bitcoin’s surge this week to $76,000, put it at its highest level in 70 days, and coincides with the 15 April ex-dividend date for the Strategy Variable Rate Perpetual Stretch Preferred Shares (STRC). We believe this significant price appreciation is attributable to a confluence of multiple layered factors.

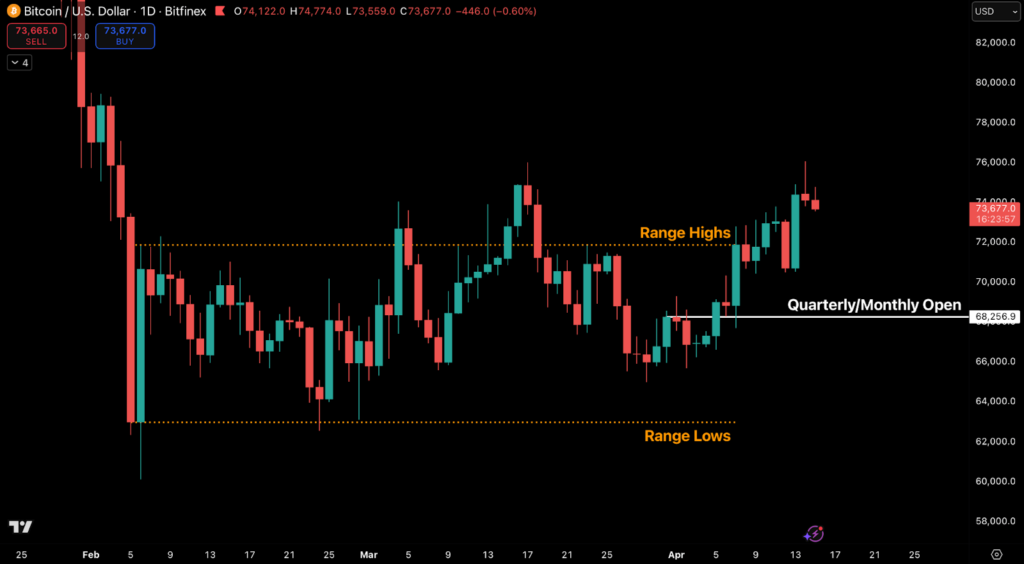
The initial catalyst was a geopolitical repricing event following the collapse of US-Iran negotiations on 12 April and the subsequent naval blockade of the Strait of Hormuz by Trump on 13 April. This macro shift abruptly caught a market positioned heavily short, triggering a rapid squeeze off the $70,700 level and liquidating an estimated $218 million in short positions.
However, the true narrative lies beyond the squeeze: the resultant selling pressure was consistently absorbed by the Strategy STRC at-the-market mechanic. This mechanism effectively functions as a dedicated ‘spot suction pump’, drawing supply from an already-thin exchange float and pushing BTC upwards.
Consequently, while macro events lit the fuse, STRC sustained the price bid, and underlying structural on-chain drainage fortifies the defensibility of this new price range.
Macro Is Driving Price, and It’s Not Going Away
The Iran ceasefire is functionally defunct. Following the collapse of 21 hours of negotiations on April 12th, the United States initiated a naval blockade of Iranian Gulf and Gulf of Oman ports at 14:00 GMT on April 13th. This interdiction extends to any vessel paying Iranian transit tolls through the Strait of Hormuz. Notably, the United Kingdom has publicly declined participation, while France is organising a parallel “freedom of navigation” mission. Consequently, the formal April 22nd ceasefire expiration is now a secondary concern; the operational environment is already post-ceasefire, a reality reflected in energy markets.
The Physical-Futures Stress Spread, which measures the differential between derivative markets and the actual price of physical barrels, printed at $28.68/bbl at the close on April 12th. This allowed us to successfully anticipate the 5 percent correction before the situation escalated. Currently, this gap remains tight, suggesting sustained market apprehension. When dated Brent crude prices are $28 above ICE futures, it unequivocally signals that insurance costs, tanker availability, and transit optionality, not OPEC policy or aggregate demand are the dominant binding constraints on the physical market.

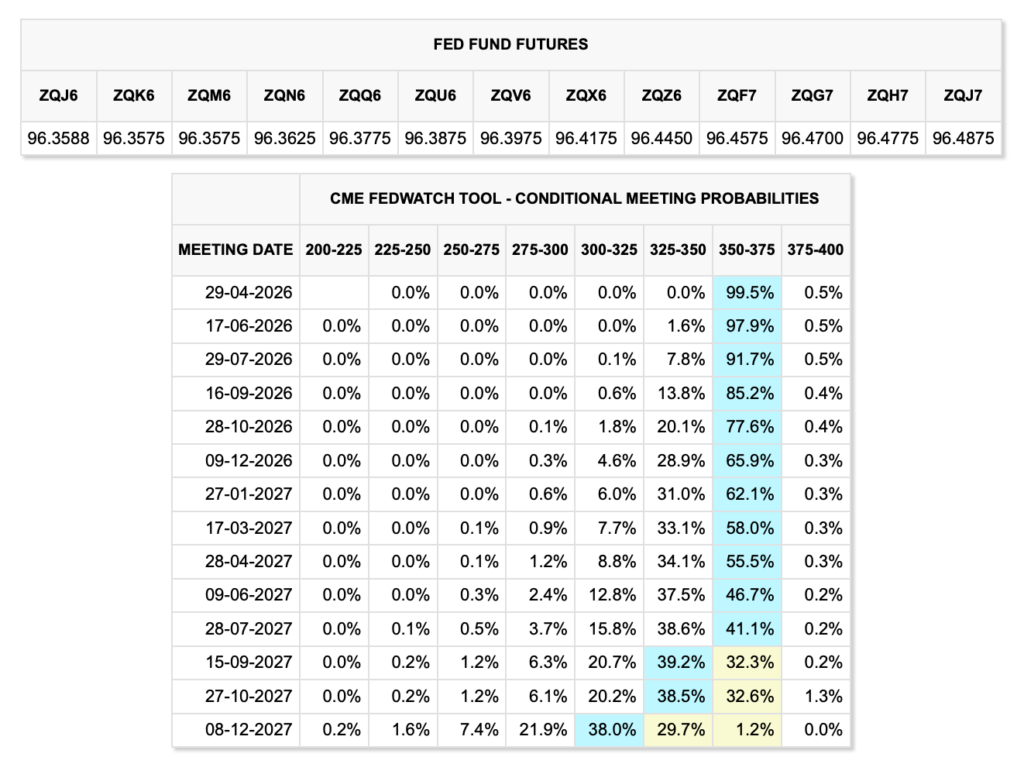
The second major macro catalyst is interest rate pricing. The April 28–29 FOMC is a non-Summary of Economic Projections (SEP) meeting, with an implied probability of 98.7 percent for maintaining the current 3.50–3.75 percent target range.
Without a new “dot plot,” forward guidance will be entirely predicated on Chairman Jerome Powell’s public statements. The key live risk is a potential oil price spike, driven by the Hormuz situation, which could compel a hawkish shift in inflation expectations.
Such a move would push real yields higher and provide the dollar with renewed strength. This single macro variable possesses the potential to arrest the current rally. Vigilance is advised regarding US 10-Year real yields and the DXY ahead of the meeting; a reading above 2.25 percent on real yields coinciding with the DXY reclaiming the 106 level should be viewed as the initial warning indicator.
STRC: the Absorption Engine Hiding in Plain Sight
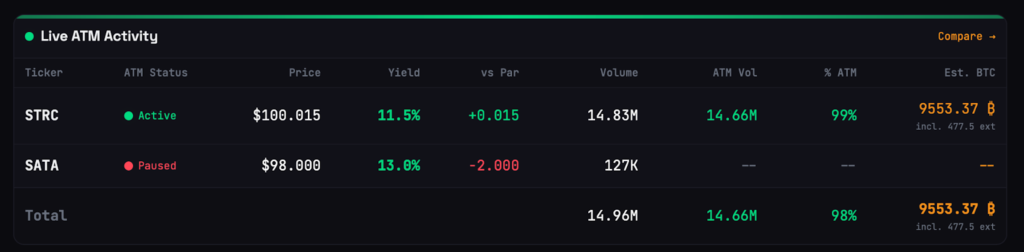
Strategy’s STRC saw a significant surge in volume, clearing $1 billion on April 13th (a new milestone) and subsequently $1.5 billion on April 14th, trading consistently at $100.005. Critically, 100% of this volume printed at or above par. This substantial activity was underpinned by the previous week’s $1 billion in funding, which facilitated the acquisition of 13,927 BTC at an approximate average price of $71,902.

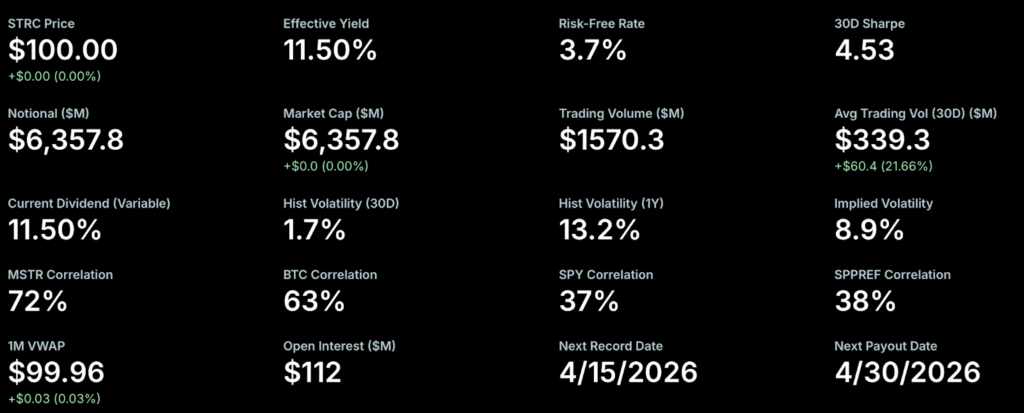
Estimates for April 14th alone suggest direct spot absorption of approximately 9,553 BTC. Operating with an 11.5% annualised dividend, the mechanism forms a self-reinforcing, closed loop: STRC trades at par, Strategy issues preferred shares into the bid, the proceeds convert to spot Bitcoin, and the ensuing buying pressure feeds into the price, thereby supporting the preferred shares at par.

This dynamic offers the clearest explanation for the market’s resilience in absorbing every major sell-off prompted by geopolitical headlines. However, it is also the single most critical and fragile component supporting the current rally.
The mid-March ex-dividend cycle, which saw a temporary pause in the “At-The-Market” (ATM) flow, coincided with a local price high inside 72 hours. While market awareness of this mechanic appears visibly heightened, evidenced by funding cooling into the print rather than aggressively piling in, the risk remains. If post-ex-dividend absorption does not smoothly transition into robust organic spot bidding, the $75,000 level is where this range-extension trade is likely to fail (because this is the level where buying pressure subsided from near the daily close).
A spot-led daily close above $75,000 will confirm the durability of this leg beyond the STRC pause. Conversely, a rejection at this level would quickly capitulate the market back into the $70,000–$71,000 range.
Derivatives and On-Chain: Acceptance, Not Wick
Market dynamics suggest the recent price movement is being accepted as fair value, and is not being rejected, a conclusion supported by on-chain and positioning data.
Footprint & Positioning:
- Cumulative Volume Delta (CVD) surged from 6.7 million to 42 million over seven daily sessions, indicating strong buying pressure.
- The Point of Control (POC) migrated from $71,590 on April 7th to $75,250 on April 14th, with the latter marked by the week’s largest volume bar at 225 million.
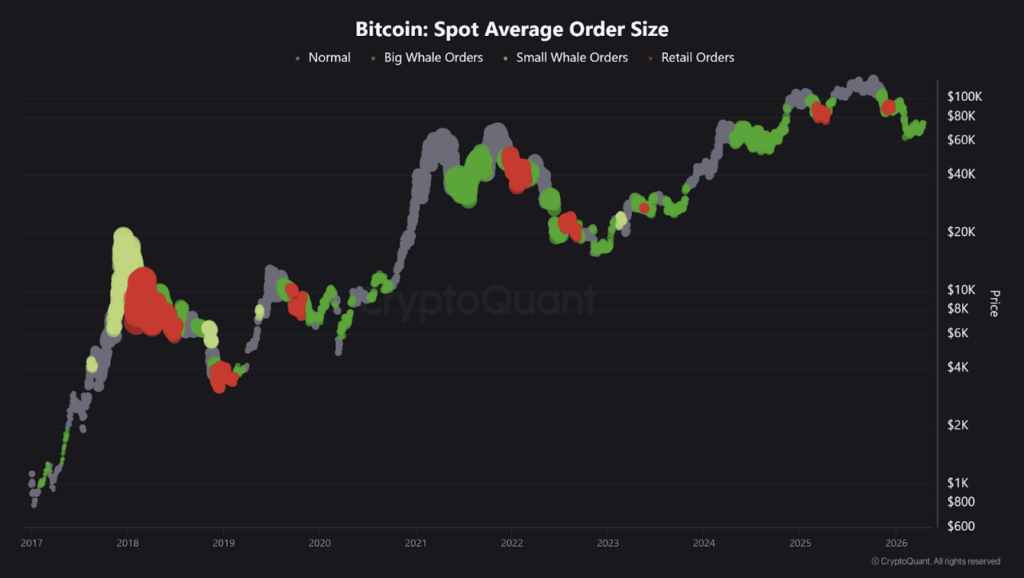
- Order-size decomposition reveals the accumulation signature is skewed toward small-whale transactions (“mid-tier accumulation signature”), echoing the structural buying visible across late 2025 and early 2026. This is structurally distinct from the 2021 blow-off top.

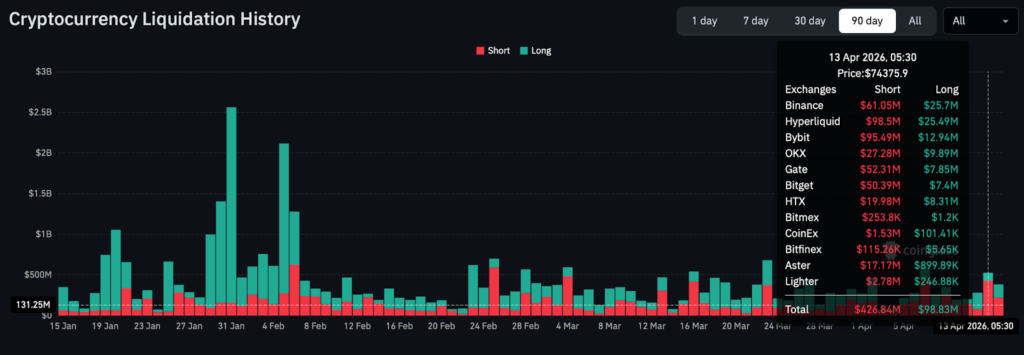
- The short-to-long liquidation ratio during the Hormuz squeeze was approximately 4:1. The April 13th BTC only liquidation number ratio was 218:8 for shorts:longs. While the $218 million aggregate deleverage was widely reported, the ratio is the more telling metric, confirming a predominantly short positioning leading into the event.

On-Chain Confirmation (Supply Side):
- Whale wallets (holding over 10,000 BTC) recorded net weekly inflows for the first time in 2026 and have accumulated an approximate 270,000 BTC over the trailing 30 days. This represents the largest sustained accumulation streak observed since 2013.
- Exchange reserves have concurrently fallen to 2.21 million BTC, the lowest reading since December 2017, underscoring a significant supply contraction.
Immediate Outlook:
- The liquidation heatmap shows dense short leverage stacked between $76,000 and $78,000. Clearing this range opens a substantial air gap in the Unspent Realised Price Distribution (URPD) up to $82,000, before encountering the significant resistance wall at the Short-Term Holder Realised Price, currently around $83,000.