
Ethereum price rose 3% to around $1,920 on Aug. 19, but weak trend strength and nearby liquidation clusters kept the recovery below $2,000.
Summary
- Ethereum price gained 3% to $1,920 but remained below the $1,986 resistance level.
- 4-hour RSI reached 61 as the MACD moved further into positive territory.
- Liquidation liquidity is concentrated near $1,930, $1,950, $1,900, and $1,870.
- Analysts identified $1,850 and $2,000 as the key boundaries for Ethereum’s next move.
According to data from crypto.news, Ethereum (ETH) price traded at $1,919 at the time of writing after reaching an intraday high of $1,930 on Binance. The latest gain extended a recovery that began near $1,870 on Aug. 17, although buyers have yet to challenge the psychological $2,000 level.
The price move came as the 4-hour chart showed improving momentum and the daily chart pointed to a weak but developing bullish bias. Large pools of leveraged positions above and below the current price could, however, keep ETH volatile within its recent range.
Ethereum price builds momentum above $1,900
Ethereum’s 4-hour chart shows that buyers regained control after the price spent several days moving sideways between approximately $1,875 and $1,900. ETH cleared the upper end of that range on Aug. 17 and has since formed a series of higher short-term lows.

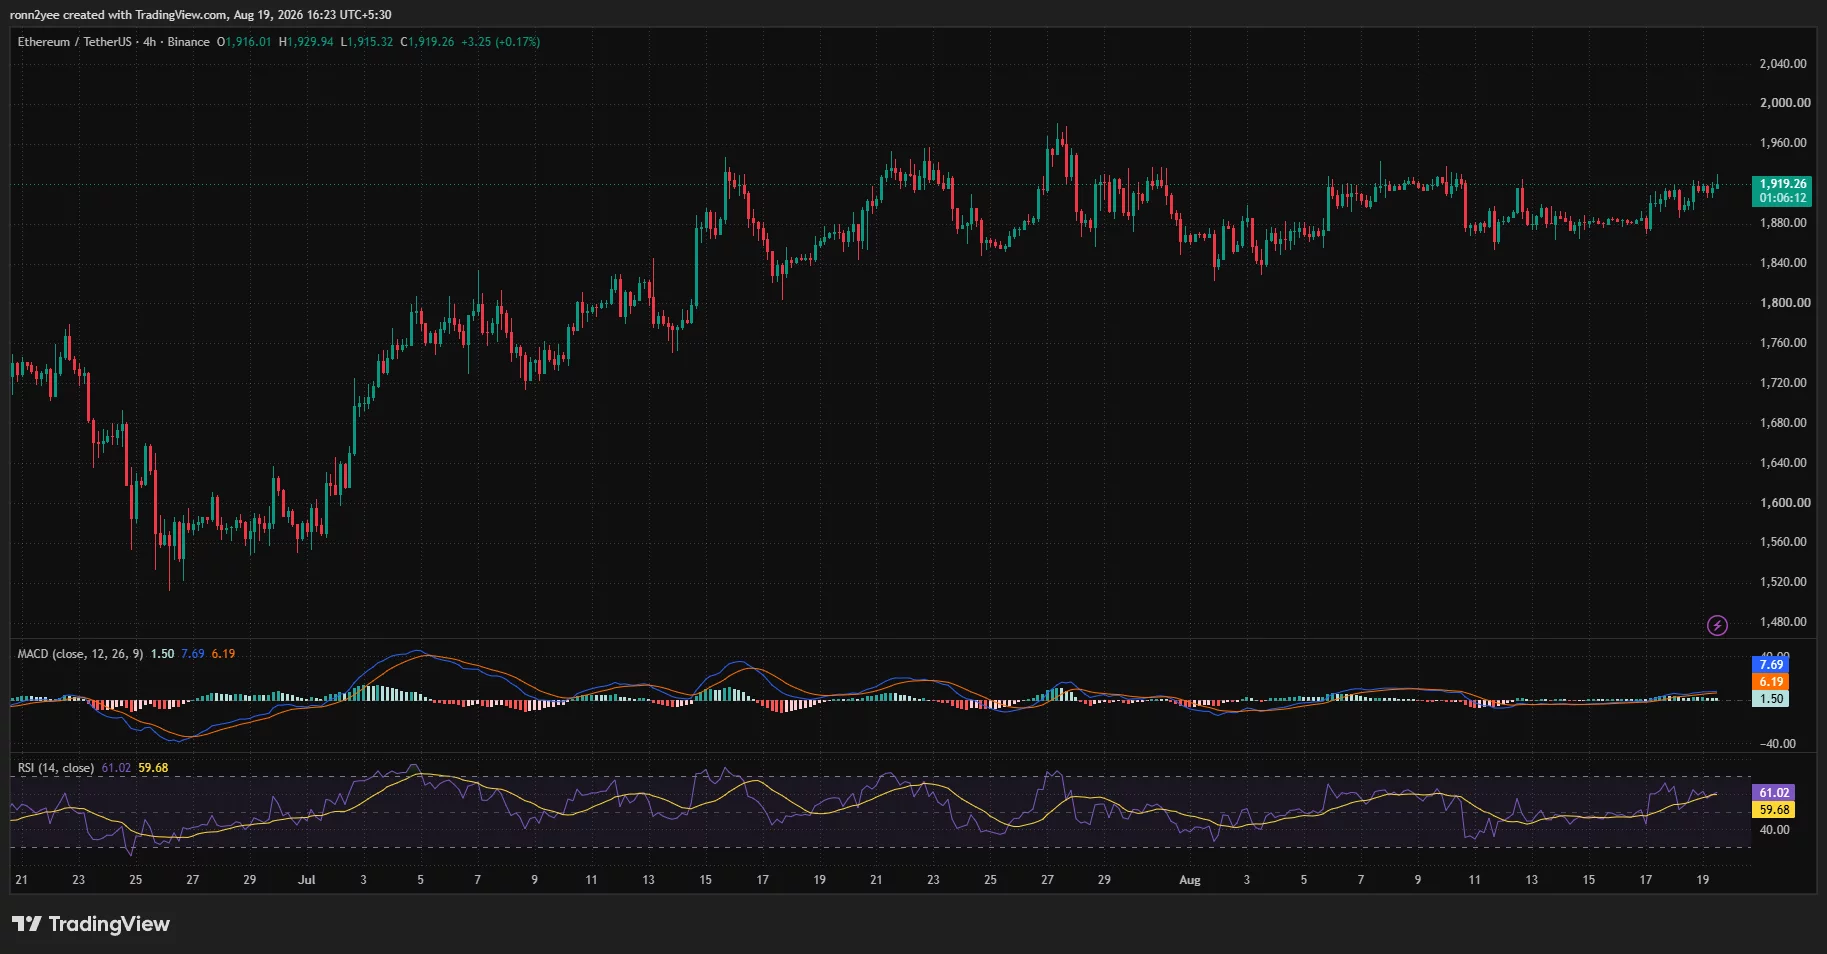
The move returned ETH to the area it occupied before an Aug. 10 decline from around $1,930 to $1,875. Buyers have tested the $1,920–$1,930 region several times since early August, making it the first obstacle to a broader recovery.
Momentum readings favor buyers over the short term. The 4-hour relative strength index stood at 61.02, above its moving average of 59.68 and the neutral level of 50. The reading remains below the overbought threshold of 70, leaving room for further gains if demand holds.
The moving average convergence divergence indicator also produced a positive setup. Its MACD line reached 7.69, above the 6.19 signal line, while the histogram registered a positive reading of 1.50. The narrow histogram shows that bullish momentum is present but has not accelerated sharply.
Daily chart puts $1,986 between ETH and $2,000
The daily chart places Ethereum slightly above the 0.618 Fibonacci retracement level at $1,872.84. The retracement is drawn from the April high of $2,464.48 to the June low of $1,507.14.
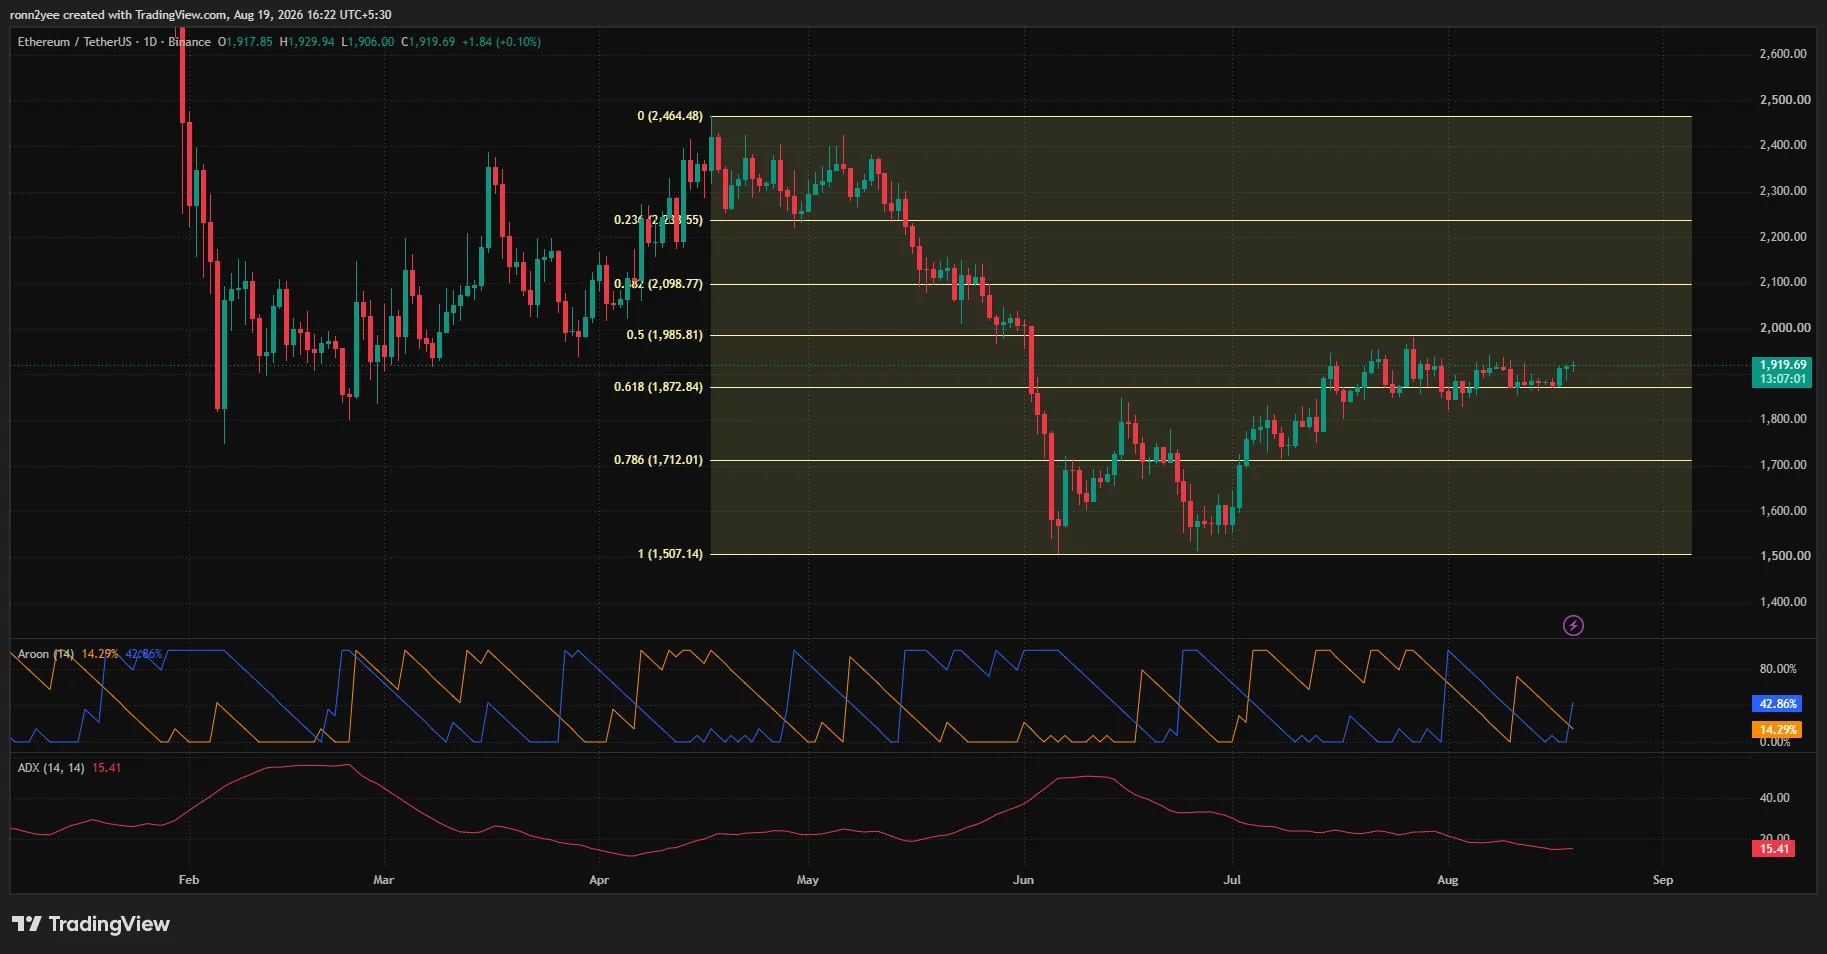
Holding above $1,873 would preserve the recovery structure and keep the 0.5 retracement at $1,985.81 in view. The latter level sits just below $2,000, creating a wider resistance zone that buyers must clear before the daily recovery can extend.
A confirmed move above $1,986 could bring the 0.382 retracement at $2,098.77 into focus. Further resistance appears at $2,237.55, although Ethereum would first need stronger trading momentum to support such an advance.
The daily Aroon indicator offers an early bullish signal, with Aroon Up at 42.86% and Aroon Down at 14.29%. The difference suggests that recent highs are exerting more influence than recent lows.
Trend strength remains the main weakness in the setup. The average directional index stood at 15.41, well below the 20–25 range normally associated with an established trend. A low ADX reading raises the risk that ETH will continue consolidating rather than immediately breaking above $2,000.
A decline below $1,873 would weaken the bullish case and expose the July consolidation area around $1,800. The next major Fibonacci support would sit at $1,712.01, although the nearer price structure provides possible support around $1,850.
Liquidation clusters surround Ethereum price
CoinGlass’ three-day liquidation heatmap shows a dense concentration of leveraged positions immediately above Ethereum’s current price. The brightest overhead band lies near $1,930, while additional liquidity extends through roughly $1,940–$1,960.

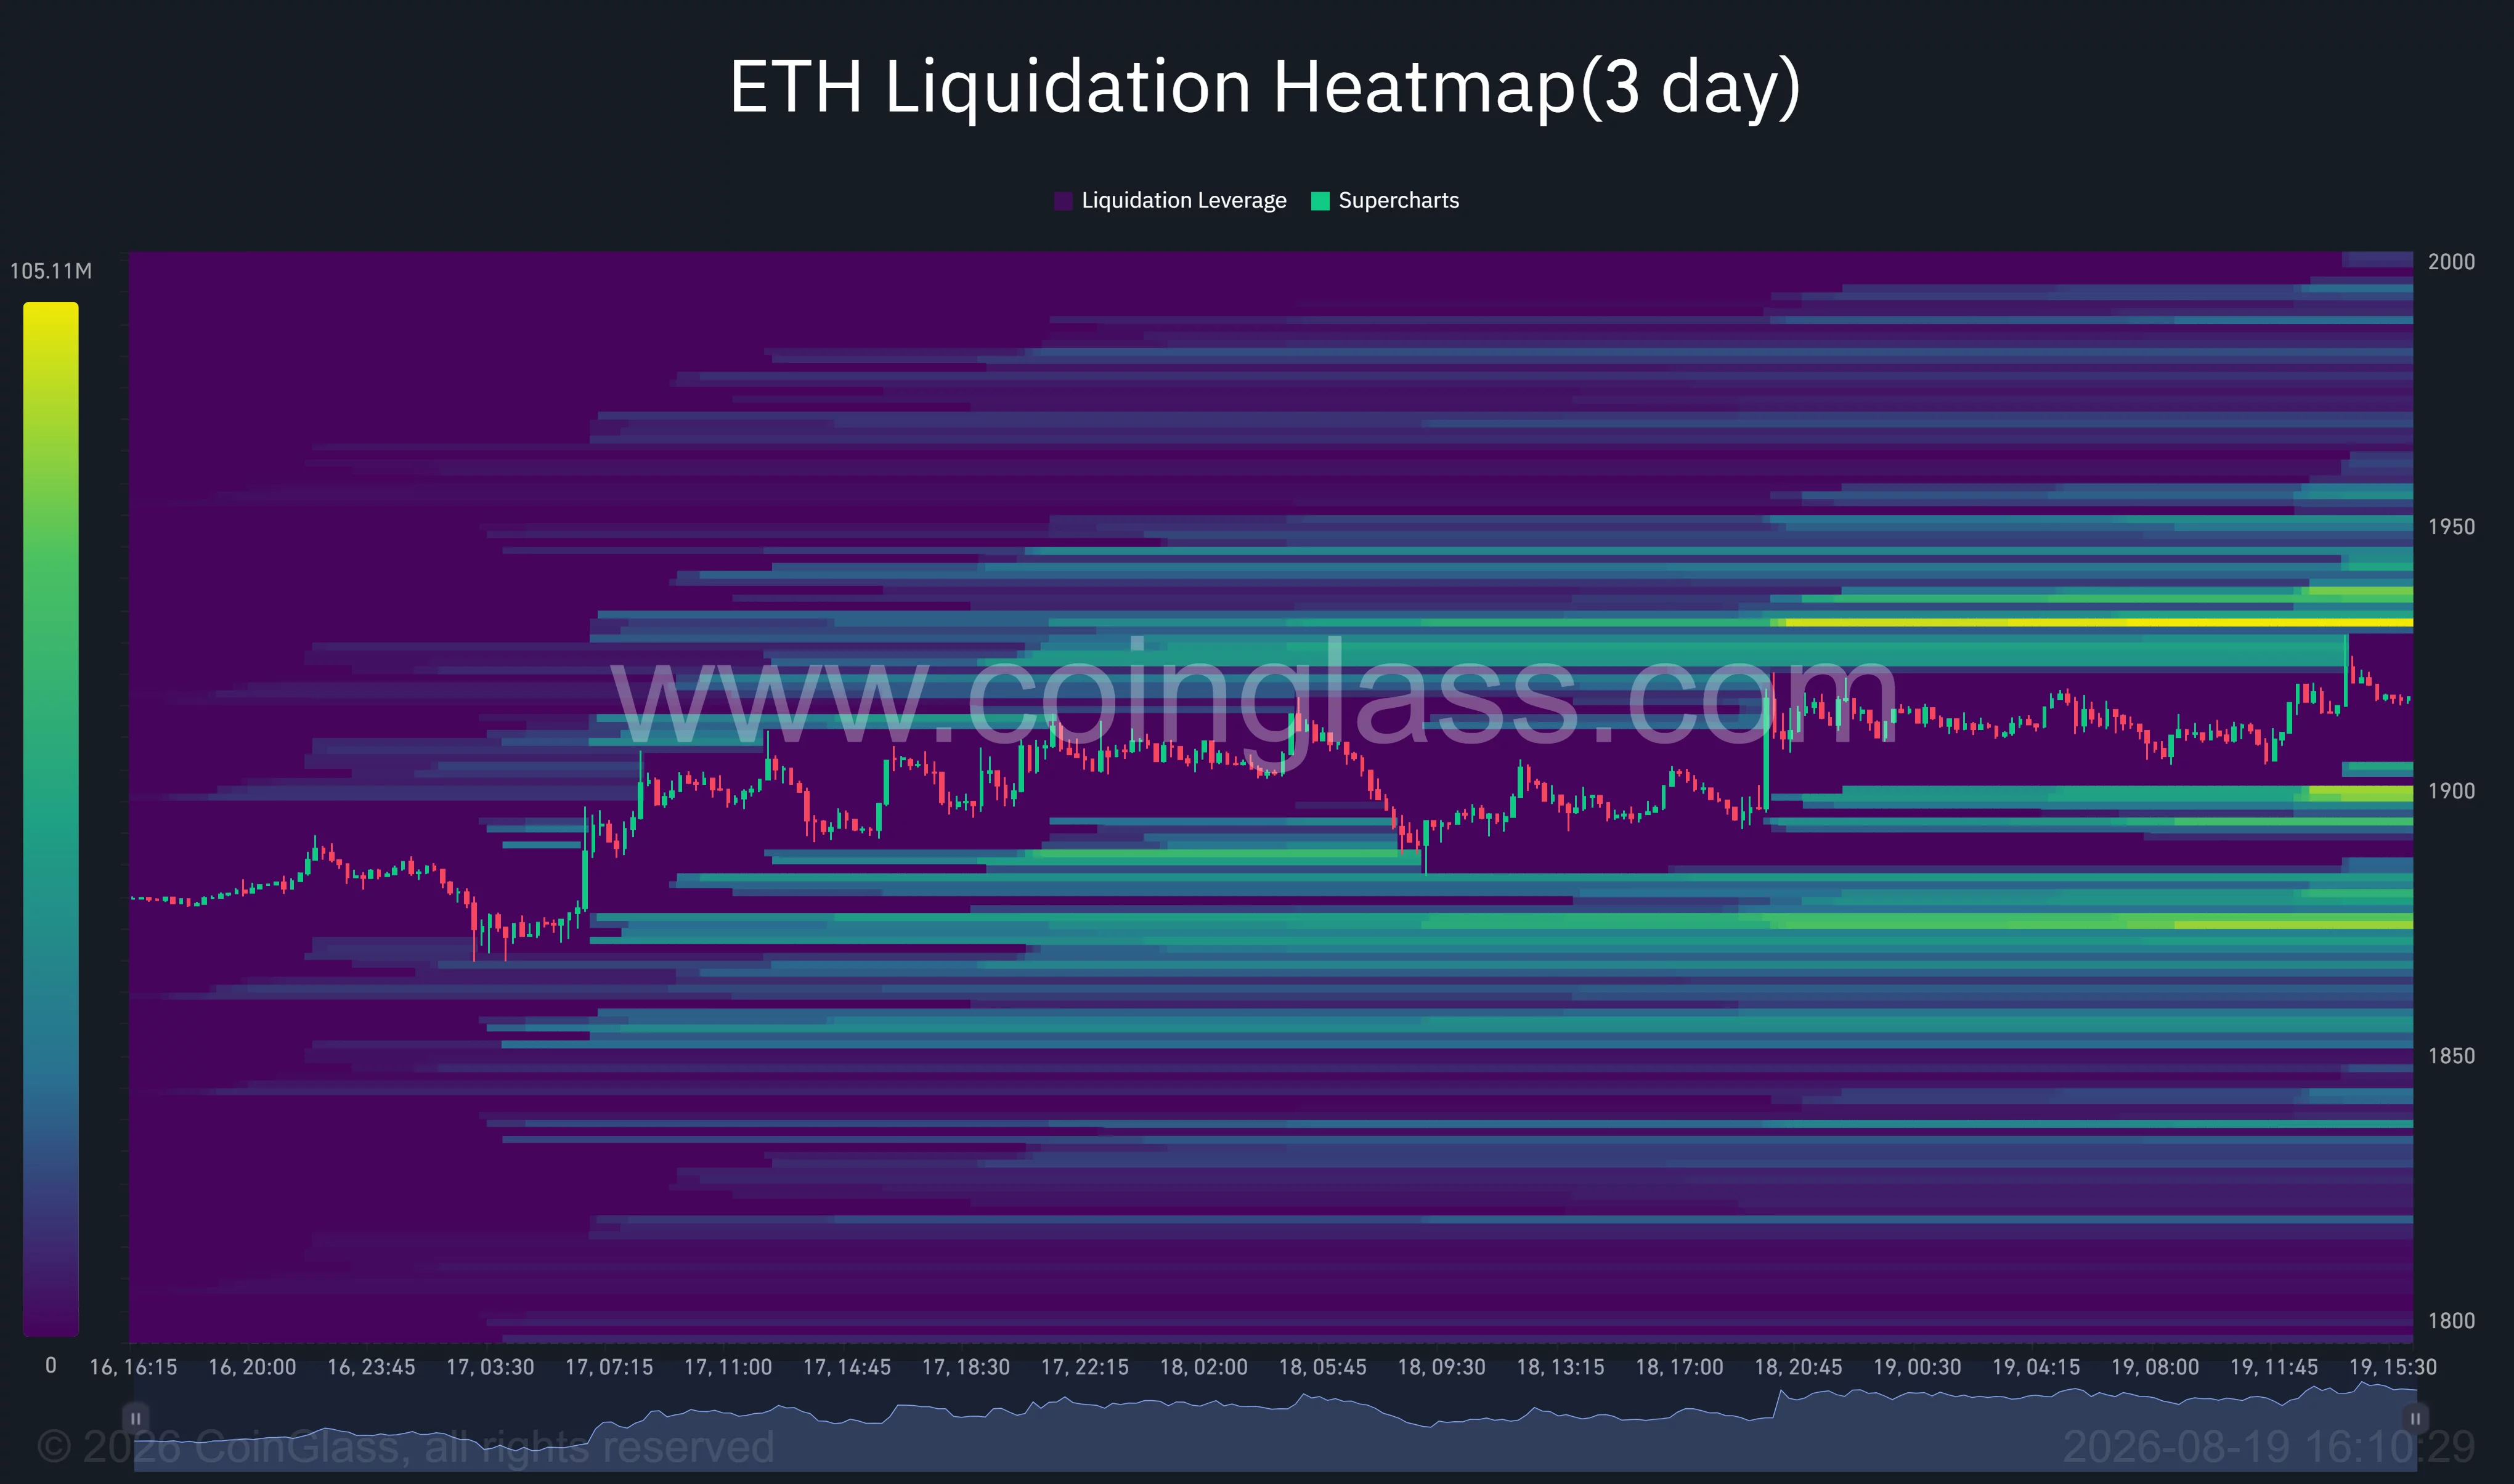
Price often gravitates toward areas containing heavily leveraged positions, but the heatmap does not determine which pool will be reached first. A push above $1,930 could force short positions to close and help ETH test the larger cluster around $1,950.
The downside also contains several liquidation pockets. One group sits near $1,900, followed by a broader and brighter concentration around $1,865–$1,880. Losing $1,900 could therefore expose ETH to a faster move toward the daily Fibonacci support at $1,873.
The distribution leaves Ethereum caught between two nearby liquidity zones. Clearing $1,930 would favor an attempt at $1,950 and then $1,986, while rejection could pull the price back toward $1,900.
Analysts watch Ethereum’s performance against Bitcoin
Crypto analyst Michaël van de Poppe said Ethereum had delivered a strong bounce against Bitcoin and could move above 0.03205 BTC in the coming weeks. He added that the rebound made it less likely that ETH/BTC would return to his preferred area for opening a long position.
A stronger ETH/BTC pair would indicate that Ethereum is outperforming Bitcoin rather than merely rising with the wider crypto market. Such a move could support the dollar pair if capital begins rotating from Bitcoin into larger altcoins.
Pseudonymous analyst Julian said Ethereum had not yet established a clear direction. He identified ETF demand, staking, Layer-2 activity, and on-chain use as factors that could support Ethereum if market liquidity and risk appetite recover.
For the price structure, Julian described a hold around $1,850 as constructive and a move back above $2,000 as a stronger sign that momentum is returning. His levels broadly match the charts, which show support between $1,850 and $1,873 and resistance between $1,986 and $2,000.
For US traders, the next directional move may also depend on whether capital returns to risk assets and whether regulated spot Ethereum funds attract stronger demand. Until ETH closes above $1,986–$2,000 with greater trend strength, its latest gain remains a recovery inside a wider range rather than a confirmed breakout.
Disclosure: This article does not represent investment advice. The content and materials featured on this page are for educational purposes only.