
Ethereum nears a golden cross on its MVRV ratio. Analysts flag key price zones as ETH trades below its realized value.
Ethereum is flashing a signal chart watchers know well. The token’s MVRV ratio is closing in on a crossover above its 160-day moving average.
Analysts call this pattern a golden cross. Traders say it has marked turning points for ETH before. The setup comes as Ethereum trades near $1,900, still well below levels seen earlier this year.
Ethereum’s MVRV Ratio Signals Possible Trend Shift
Analyst Ali Charts flagged the pattern on X. The MVRV Momentum indicator compares holder profitability to its medium-term trend line.
ETHEREUM: GOLDEN CROSS
Ethereum is approaching a bullish crossover on its MVRV ratio against its 160-day SMA.
The MVRV Momentum tracks the relationship between aggregate holder profitability and its medium-term trend line. When the daily MVRV ratio breaks back above its 160-day… pic.twitter.com/RMIe2OA1rG
— Ali Charts (@alicharts) July 23, 2026
A crossover above the 160-day SMA often points to a shift out of capitulation. It can also mark the start of fresh accumulation among holders. Over the past three years, similar crossovers have lined up with major recovery phases for ETH.
Each instance came after extended periods of seller dominance in the market. The current setup follows months of weak price action across the broader token.
Read also: Ethereum Flips Into Uptrend as Tokenized ETF Inflows Hit $327.3M in 12 Months
ETH Price Action Eyes Key Liquidity Zones
Trader Ted Pillows pointed to a liquidity cluster forming between $1,870 and $1,900. He said Ethereum could sweep this zone as markets show early signs of correction.
A move through that range could open the door to $1,980 and $2,000. Ted called that upper zone worth watching once the sweep plays out.
$ETH has formed a liquidity cluster around the $1,870-$1,900 level.
With markets showing slight correction, Ethereum could sweep this liquidity zone.
But after this, a rally towards $1,980-$2,000 would start to look interesting. pic.twitter.com/WgCRSxE2qf
— Ted (@TedPillows) July 23, 2026
CoinGecko data puts ETH at $1,898.54 at the time of writing. Trading volume over the past 24 hours reached $9.53 billion. The token slipped 1.10% on the day but held a 1.61% gain across the past week.
On-Chain Data Shows Ethereum Cheaper Than Bitcoin
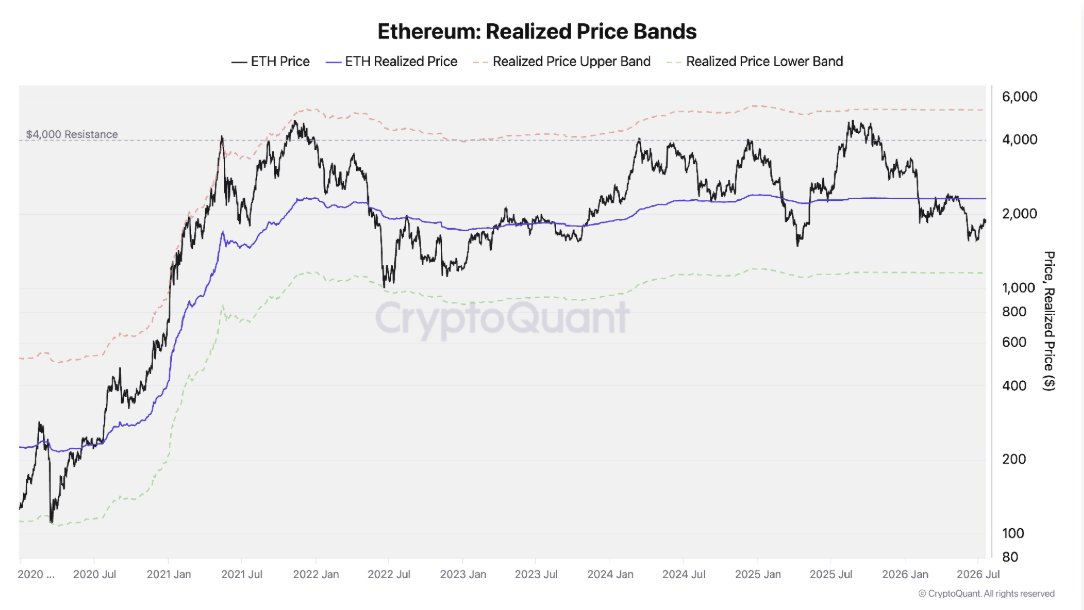
CryptoQuant research points to Ethereum trading below its realized cost basis.
ETH sits roughly 17% under its realized price of $2,304. That places it in the lower half of its realized price band. Historically, this zone has lined up with market bottoms and stronger upside potential.
The ETH/BTC MVRV ratio has also cooled sharply. It peaked near 0.95 in August 2025 and now sits around 0.65. That reading stays above the 0.45 mark tied to past ETH bottoms against Bitcoin.

Selling pressure between the two assets appears to be easing as well. The ETH/BTC exchange inflow ratio dropped from a spike above 1.5 to near 0.8.
CryptoQuant noted this remains above the 0.4 threshold seen at prior lows. Institutional appetite is showing early signs of a turn too. The ETH/BTC ETF holdings ratio fell to about 0.115 in June before climbing back to 0.13.
Weekly spot volume between the pair has also collapsed, dropping from 1.75 to roughly 0.5. CryptoQuant said two of five tracked signals now sit at bottoming levels, while the rest continue to improve.