
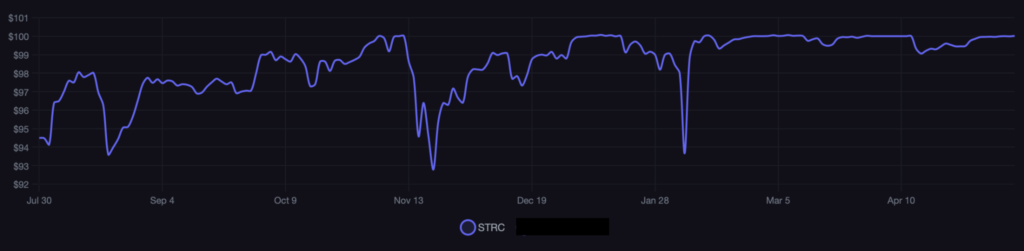
Bitcoin is holding within a tight range since the weekend, after reclaiming the two cost-basis levels that defined resistance: the True Market Mean (TMM) at $79,200 and the Short-Term Holder cost basis (STHRP) at $79,500 with a new high reached of over $82,000 on 10 May. Spot flows suggest the projected buying pressure expected around 15 May (the most recent STRC ex-dividend record date) was pulled forward, however the lack of follow-through after reclaiming those resistance levels, is concerning.
This could lead to a retracement over the next few days.

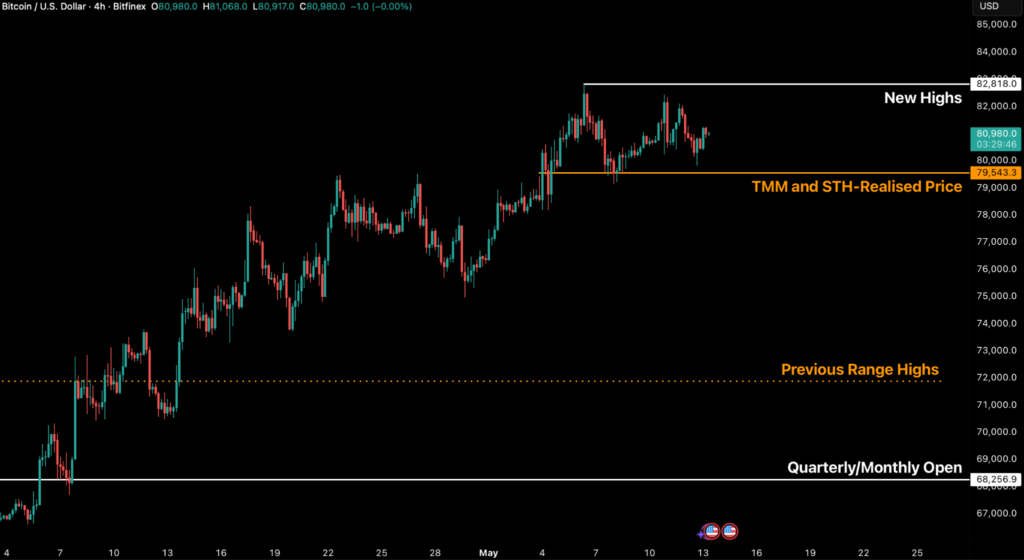
The TMM and STHRP are dynamic levels that act as support or resistance respectively, representing the average cost basis across a varied cohort of participants who typically transact around their cost basis. Continuously retesting those levels as support, and failing to expand, even with solid Exchange Traded Funds (ETF) buying and reduced miner distribution, places the market in a neutral region.
In addition, the corporate-treasury channel that had previously powered the prior leg upwards, has stepped back materially. The institutional bid is narrowing toward a single channel (ETFs), and that shift is the behavioural story of the week so far.
Macroeconomic Backdrop
The current economic environment is restrictive. On Tuesday, the US 10-year Treasury yield rose to a peak of 4.42 percent, pushing expectations for rate cuts further into the second half of 2026. While nominal yields are rising, the Dollar Index has held steady at 97.88 and the S&P 500 gained 0.84 percent to reach 7,398.93. Investors still have an appetite for risk, despite rising yields.

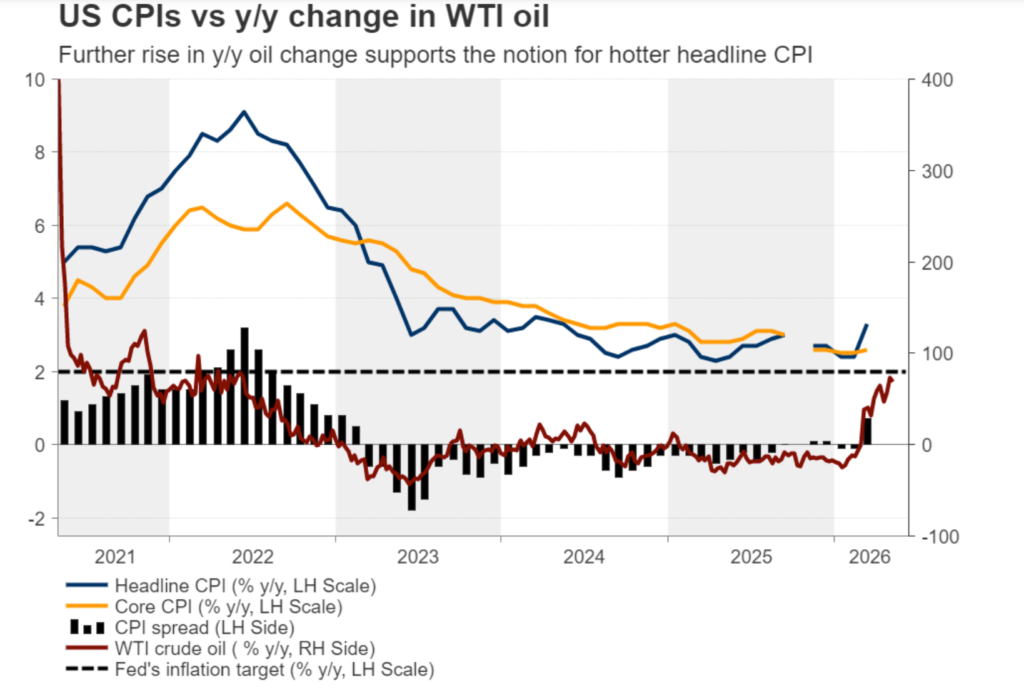
And with year-on-year energy costs running higher through April, it is likely that inflation is rising.
High interest rates are capping price growth in assets that do not provide a yield, and though there has been a positive correlation between bitcoin and equities, the current recovery is being driven by a general move into risk assets and not a shift toward bitcoin as a stable form of money. That distinction matters for the derivatives market: while rallies in risk assets are usually supported by direct buying, this recovery shows more signs of leverage.
Options: Skew Flattens, Gamma Tightens
Call options make up nearly 57 percent of total open interest. The most concentrated contract is the $80,000 call for late May. A cluster of put options has also formed at the $85,000 level, worth over $1.2 billion, likely a way for traders to hedge exposure to the underlying. However, the skew is becoming more neutral as traders move away from the heavy hedging that defined April. The reduction in short-term protection is a notable trend this week.
Implied volatility has risen significantly from its late-April lows and currently sits near 45 percent. Dealers are preparing for more price movement than we have seen recently.
The most significant data point is gamma positioning. A concentrated short gamma cluster of roughly $2 billion has built up around the $82,000 level. In this environment, dealers must buy as prices rise and sell as prices fall, which can accelerate moves.

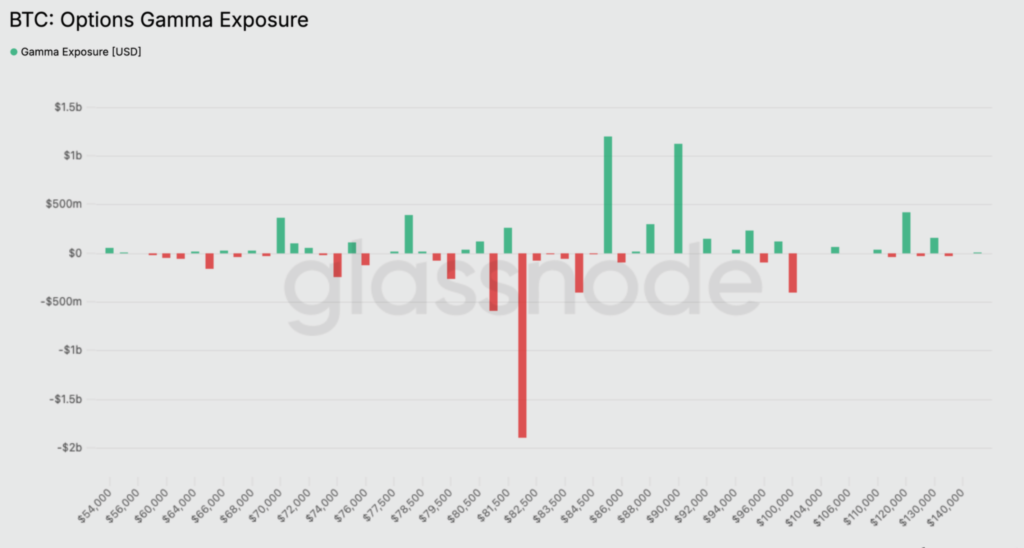
Recent options activity has favoured call buying, so dealers have been forced to buy to manage their risk. A move between $82,000 and $85,200 could be very volatile, while a drop below $79,000 could be equally fast.
The market is positioned to break sharply rather than stay in a quiet range.
On-Chain Data and Challenges
On-chain data is more constructive now than at any point since early February. Total realised profit and loss has turned positive for the first time in three months. The shift is small, but the change in direction is important. With the rally to the current range, long-term holders have started taking some profits, selling about $180 million per day. That is a moderate amount compared with past cycles and suggests current selling is controlled.
The concern lies in daily realised losses, which are still averaging $479 million. In quieter periods, this figure sits closer to $200 million. Until losses drop to the $200 million band, the on-chain recovery is not fully confirmed. Price has returned to average levels, but seller behaviour has not yet normalised. The market is improving but is not yet stable, which leaves room for the price moves outlined in the options section.
Key Metric: Treasury Bid Composite (TBC)
Through much of 2024 and 2025, two groups of institutional buyers supported the market:
- The ETF channel: US spot bitcoin ETFs, representing demand from traditional funds.
- The DAT channel: Digital Asset Treasuries, which are public companies that buy bitcoin for their balance sheets.
Both groups provide stability. If one stepped back, the other could maintain the price.

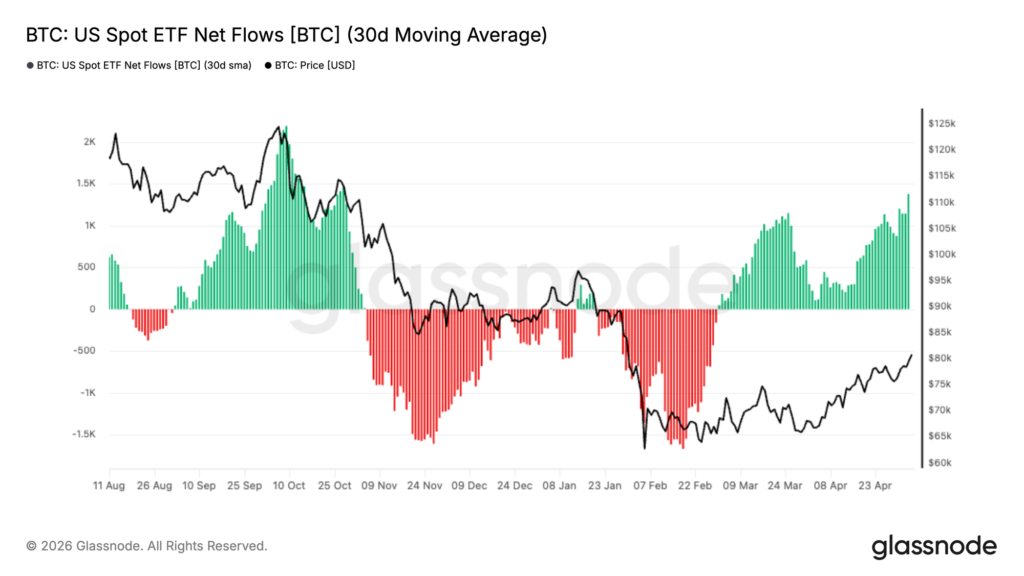
This week, only the ETF channel is active. Average monthly flows for ETFs have been positive, with significant buying recorded through March and April.

Corporate buyers, by contrast, have gone quiet. Major players bought very little bitcoin last week, with an 80 percent drop in purchase volume compared with last month.
Alternative Viewpoint
While this means traders should be cautious around near-term price trajectory, an alternative view is that negative funding in the perpetuals market, combined with a price recovery sets up a short squeeze, with a target of $85,200. Another reading is that the same factors supporting a squeeze also act as a cap on the price.
Dealers may chase prices higher initially, but their behaviour shifts once price clears a certain level. At that point, their hedging starts to slow the move rather than accelerate it. Given the high level of realised losses still in the market, a direct push to $85,200 looks less likely. A quick jump to the $82,000 to $84,000 range, followed by a period of neutralisation, seems more probable. In that scenario, the squeeze is a temporary trigger rather than a durable trend.
Key Events to Watch
The following events will offer more information before the full report on Monday.
- Wednesday 13 May: BitGo Q1 earnings will provide the first read on institutional storage trends and help confirm whether more large investors are entering the market.
- Thursday 14 May: The performance of specific corporate assets will indicate whether large companies are still interested in using bitcoin for their treasuries.
- Friday 15 May: STRC dividend record date. A stable rate would be a positive signal for the market.
- Through 16 May: Watch for reports of large bitcoin sales by major companies, which could weigh on the market.
- Ongoing: Monitor whether realised losses drop below $200 million per day, which would confirm the recovery is sustainable.
- Ongoing: Watch for funding to turn positive. If it rises too high, it could signal crowded positioning on one side of the trade.
The current range for bitcoin is $79,100 to $85,200. The question for the rest of the week is whether retail demand through ETFs can hold the price up, or whether larger corporate buyers will need to return.