

Chainlink price has been in a strong downtrend since late August and is now close to confirming a bearish double top pattern. In the meantime, whales have started offloading significant amounts of LINK, which could trigger further downside ahead.
Summary
- Chainlink price has dropped 16% over the past month.
- Whale selling and a rise in exchange balances continue to pressure LINK prices.
- A large-scale bearish double top pattern has formed on the weekly chart.
According to data from crypto.news, Chainlink (LINK) was trading at $12.49 on Tuesday, Dec. 23, with a market cap of $8.84 billion. LINK price has dropped 16% from its monthly high and nearly 55% from its year-to-date high.
Chainlink price has been declining since August amid Investor concerns over U.S. tariffs on key economies, and the Federal Reserve’s interest rate policy, which led to a general risk-off sentiment in crypto markets.
Further data from DefiLlama shows that the total value locked in Chainlink-based DeFi applications has dropped to around $545 million at press time from over $1.13 billion recorded in late August. At the same time, weekly fees have consistently dropped since September.
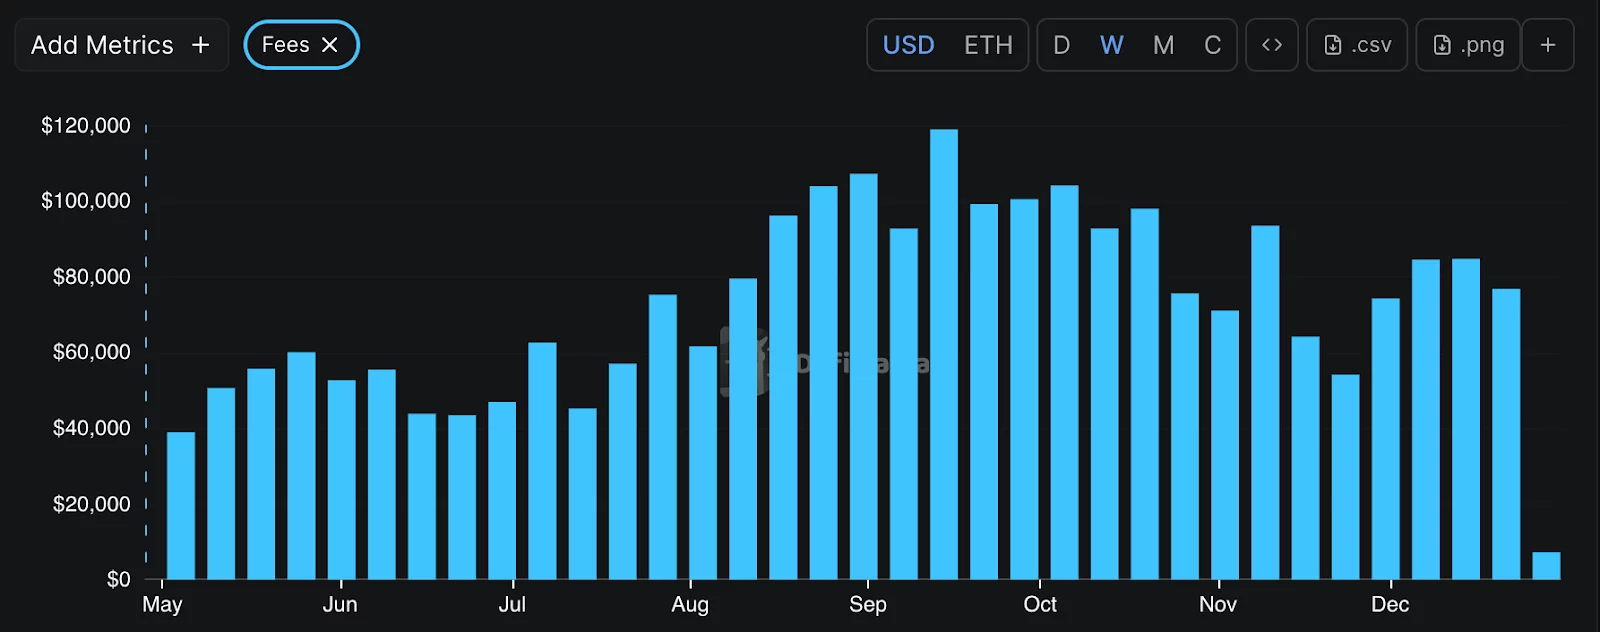
Declining TVL and a corresponding drop in weekly fees indicate a slowdown in overall usage and demand for Chainlink’s services within the DeFi sector, which in turn has kept investor appetite for the asset in check.
Following this drop in on-chain activity, whale demand for the token has also taken a hit. Data from Nansen shows that the total balance of tokens held by whales has dropped by 2% over the past 7 days to 1.84 million when writing.
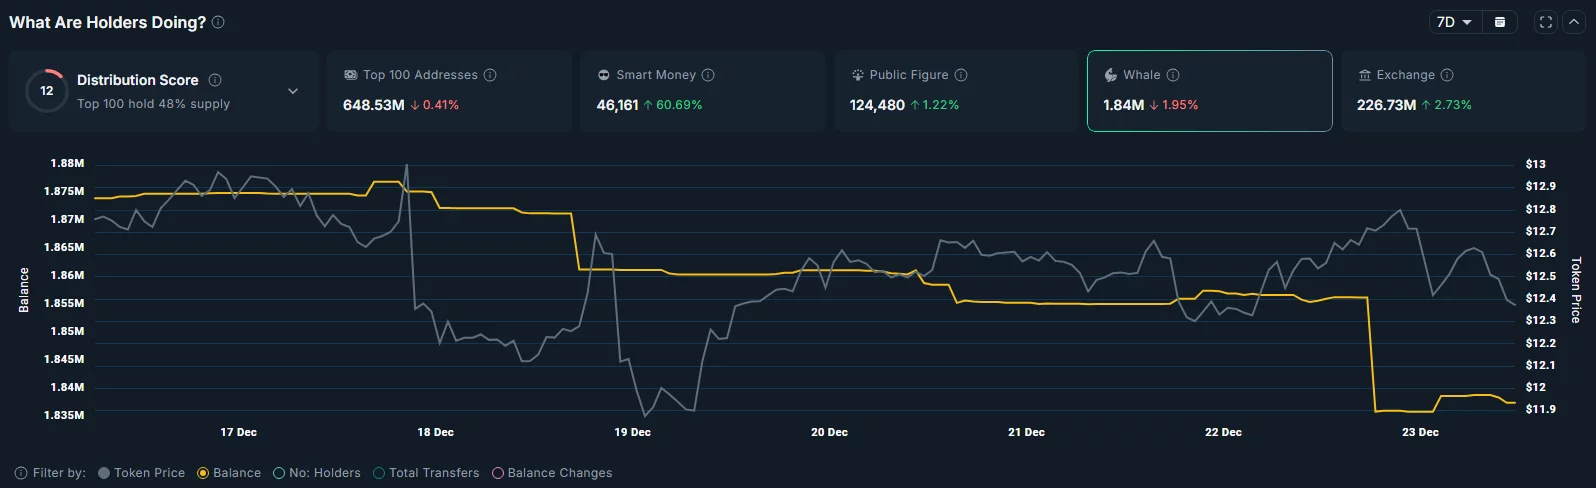
Within that period, the total balance of LINK tokens held across exchanges has also increased 2.7% to 226.73 million, which could likely drive more selling pressure and thus further depreciation in LINK price.
The weekly chart for Chainlink price also seems to suggest more pain ahead for the token.
It shows the formation of a multi-year double top pattern, which has historically appeared ahead of a major drop in crypto assets. The tops appear to have formed around $28.06, while the neckline has formed at $11.08.
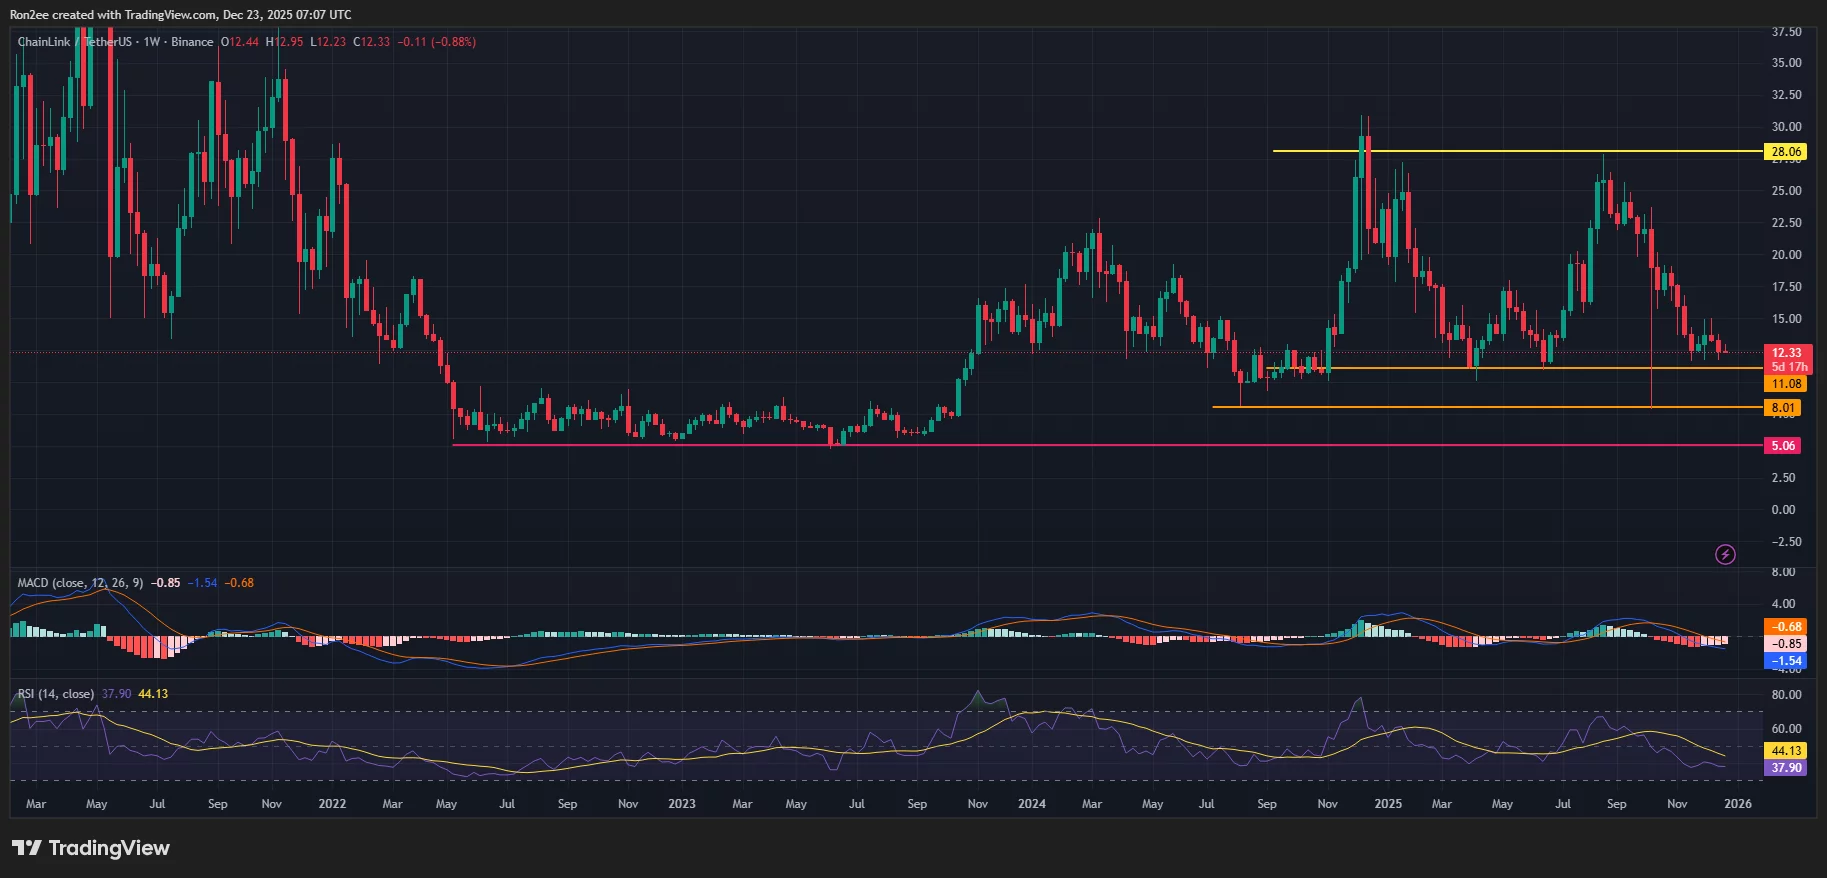
At press time, momentum indicators have also pointed downwards. Notably, the MACD line has crossed below the signal line with both trending lower, an indication that bears are still firmly in control of the market.
LINK’s RSI, which has dropped from near overbought levels to around 37.7, has yet to enter oversold territory, indicating there may be further room for downside before any meaningful reversal can occur.
For now, the key level to watch is the $11.08 neckline. A drop below this could trigger a sharp sweep down to $8 or even $5, which had served as a strong floor during the 2022 to 2023 period. The said price lies nearly 60% below the current level.


Leave feedback about this