
Bitcoin price has retreated from nearly $67,000 after escalating U.S.-Iran hostilities pushed oil prices higher and tempered optimism created by progress on the CLARITY Act.
Summary
- Bitcoin pulled back after briefly touching $66,965 as sellers defended the $67,000 resistance level.
- CLARITY Act progress, ETF inflows and short liquidations fueled BTC’s rapid advance.
- Rising oil prices and the U.S.-Iran conflict threaten a sustained breakout toward $70,000.
According to data from crypto.news, Bitcoin (BTC) price rose from an intraday low of $65,149 to $66,965 on July 21 before sellers forced the price back to about $66,440. The asset remained up 1.8% on the day, but its failure to hold $67,000 showed that traders were unwilling to chase the rally as energy and inflation risks returned.
CLARITY Act progress and ETF inflows have fueled Bitcoin’s rally
Bitcoin’s advance began after the White House and Senate negotiators reached an agreement on an ethics provision that had delayed the Digital Asset Market Clarity Act. Treasury Secretary Scott Bessent described negotiations as being at the “1-yard line,” while senators suggested the bill was close to a final vote.
The proposed ethics rules address concerns about elected officials and senior government figures holding or promoting crypto assets while in office. Reports that President Donald Trump had accepted the provision helped crypto-linked stocks rally, with Coinbase and Circle shares gaining as much as 10% during the session.
U.S. spot Bitcoin exchange-traded funds added another source of demand. According to SoSoValue data, the funds recorded about $227 million in net inflows on July 20, their fifth consecutive positive session and their longest inflow run since April.
The ETF streak followed a difficult June, when investors withdrew billions of dollars from the products. Five days of fresh allocations have helped absorb available supply while Bitcoin has recovered from its June low near $58,000.
Spot activity also remained firm during the latest advance. Commenting on the order flow, analyst Ted Pillows wrote:
“Consistent spot buying for BTC now. This looks much better.”
Leverage amplified the initial breakout. Market data showed roughly $223 million in crypto positions liquidated over 24 hours, including about $181 million in shorts. Forced purchases by bearish traders helped Bitcoin clear $65,000 and accelerate through the $66,000 resistance area.
A separate derivatives event later exposed the rally’s fragility. According to trader Daan Crypto Trades, a position worth more than $100 million appeared to close at market, erasing over $250 million in Bitcoin open interest within one minute.
BTC briefly fell toward $65,900 before recovering most of the decline, which Daan attributed to a possible execution error or an attempt to trigger cascading liquidations.
Oil risks and overhead supply have blocked a clean $67,000 breakout
Oil prices have complicated the bullish setup. U.S. crude climbed about 2.6% to $84.70 per barrel, its highest level since June 12, as supply fears grew across the Strait of Hormuz and the Red Sea.
Washington carried out a tenth consecutive day of strikes against Iran, while Trump warned that Tehran “will pay” for attacks that killed American soldiers. Reuters also reported damage to a tanker near the Strait of Hormuz and disruption involving Saudi crude shipments after threats from Iran-aligned Houthi forces.
Higher energy costs could feed into July inflation and give the Federal Reserve less room to support financial markets. The dollar strengthened as traders reassessed the chances of higher interest rates, creating a potential headwind for Bitcoin and other speculative assets.
On the daily chart, BTC has moved above the Bollinger Band midpoint at $63,839 and briefly exceeded the upper band near $66,100. Trading above the upper band confirms strong buying pressure, but the rejection from $66,965 raises the risk of a pullback toward the band’s midpoint.

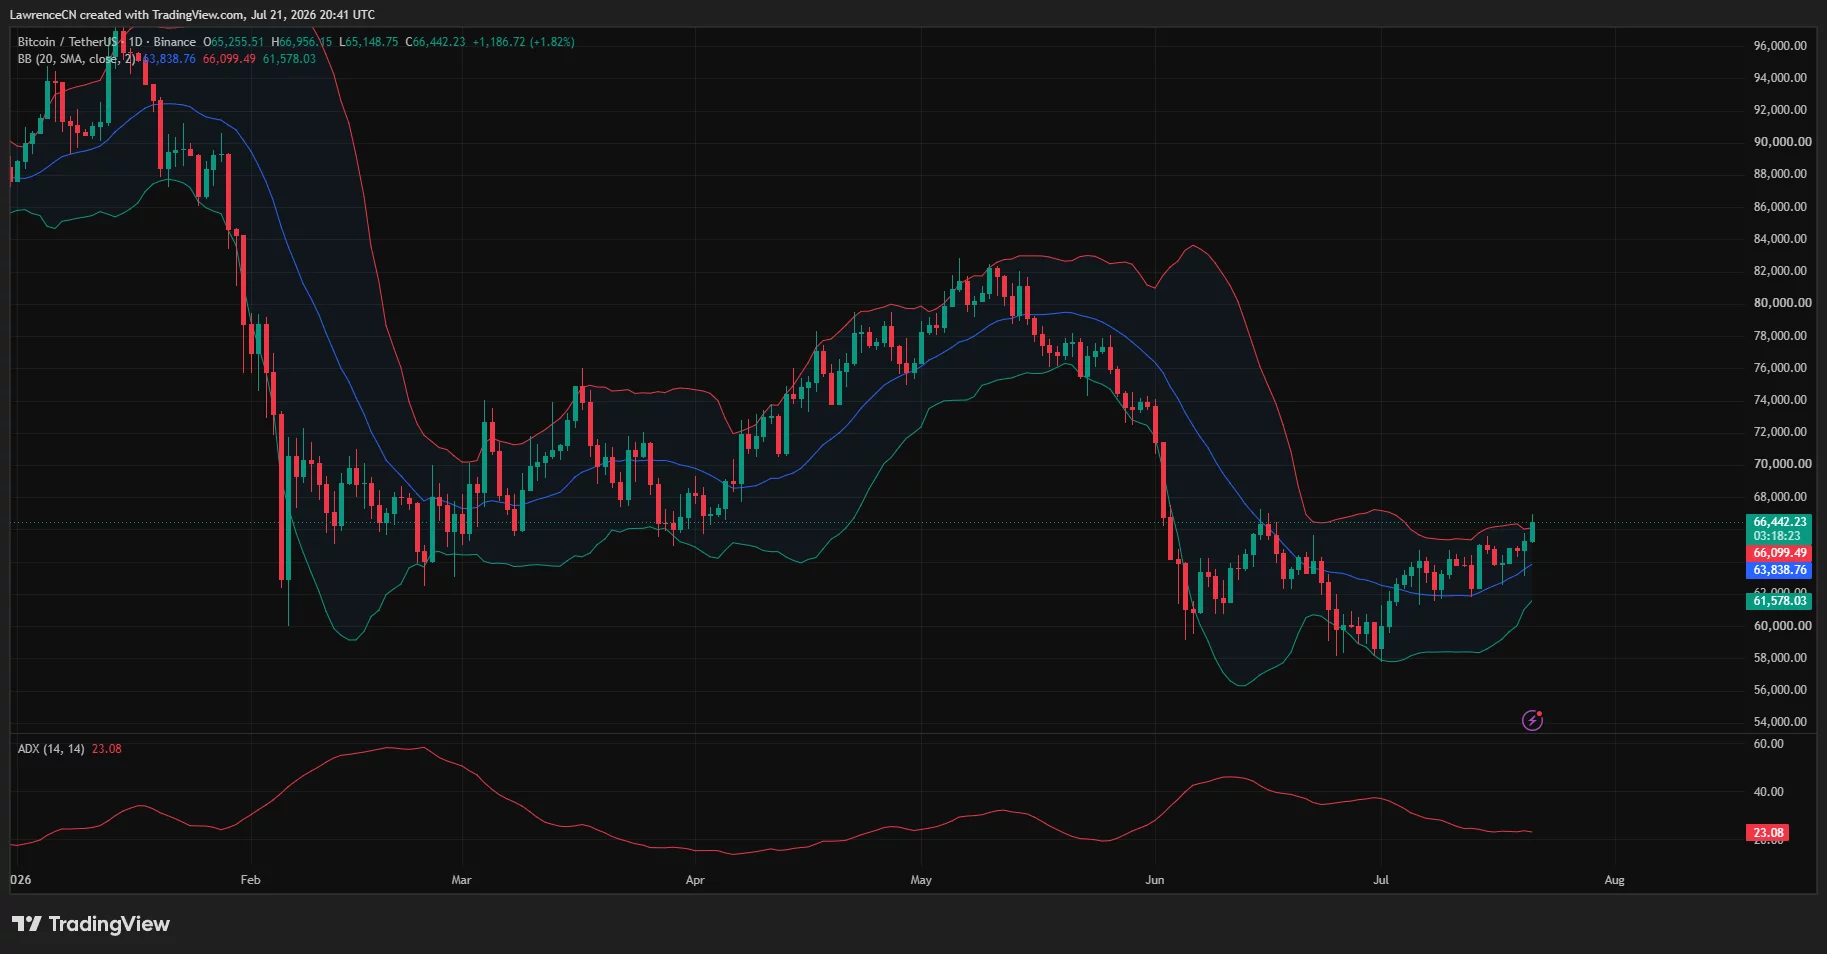
The Average Directional Index stood at 23.08. A reading below 25 means the daily trend has not yet gained enough strength to confirm a sustained directional move, despite Bitcoin’s recovery from the June trough.
Bitcoin has also reached the upper boundary of an ascending parallel channel on the four-hour chart. Resistance sits between $67,000 and $67,800, while the channel floor runs near $64,000. A four-hour close above $67,800 would clear the structure and expose $69,500, followed by the psychological $70,000 level.
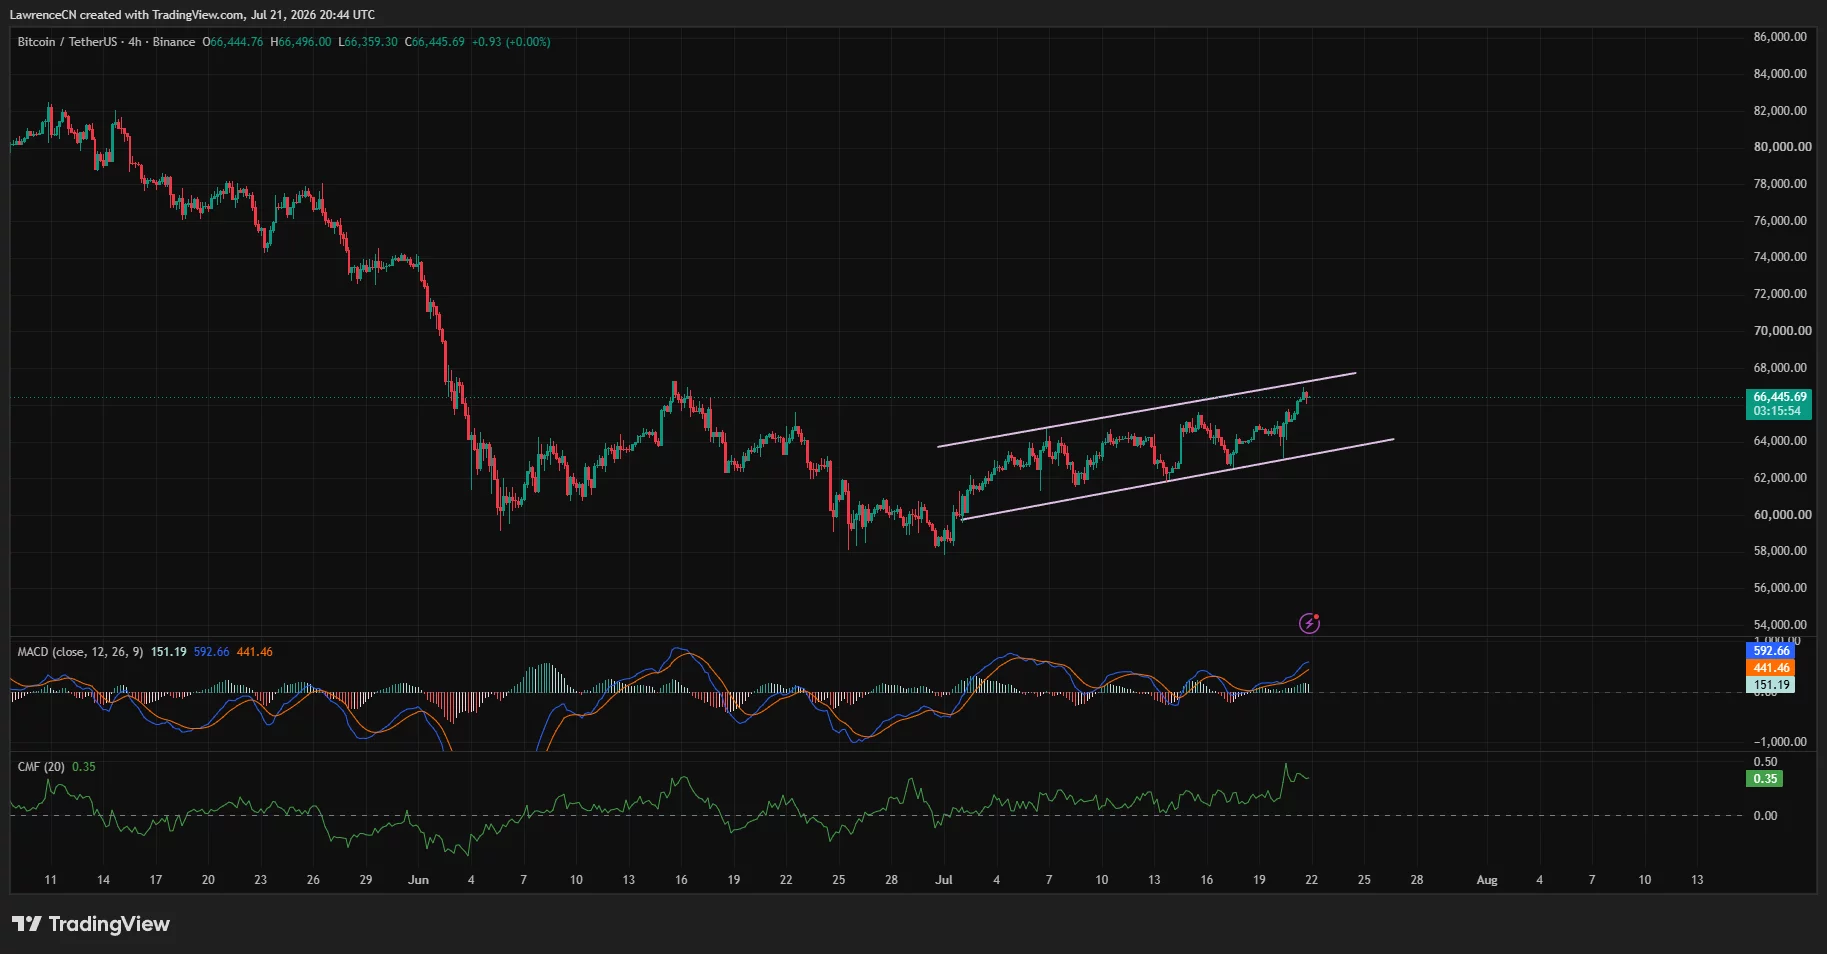
Momentum still favors buyers. The four-hour MACD line stood at 592.66, above its 441.46 signal line, while the positive histogram reached 151.19. The Chaikin Money Flow reading of 0.35 showed that capital continued to enter the market despite the rejection.
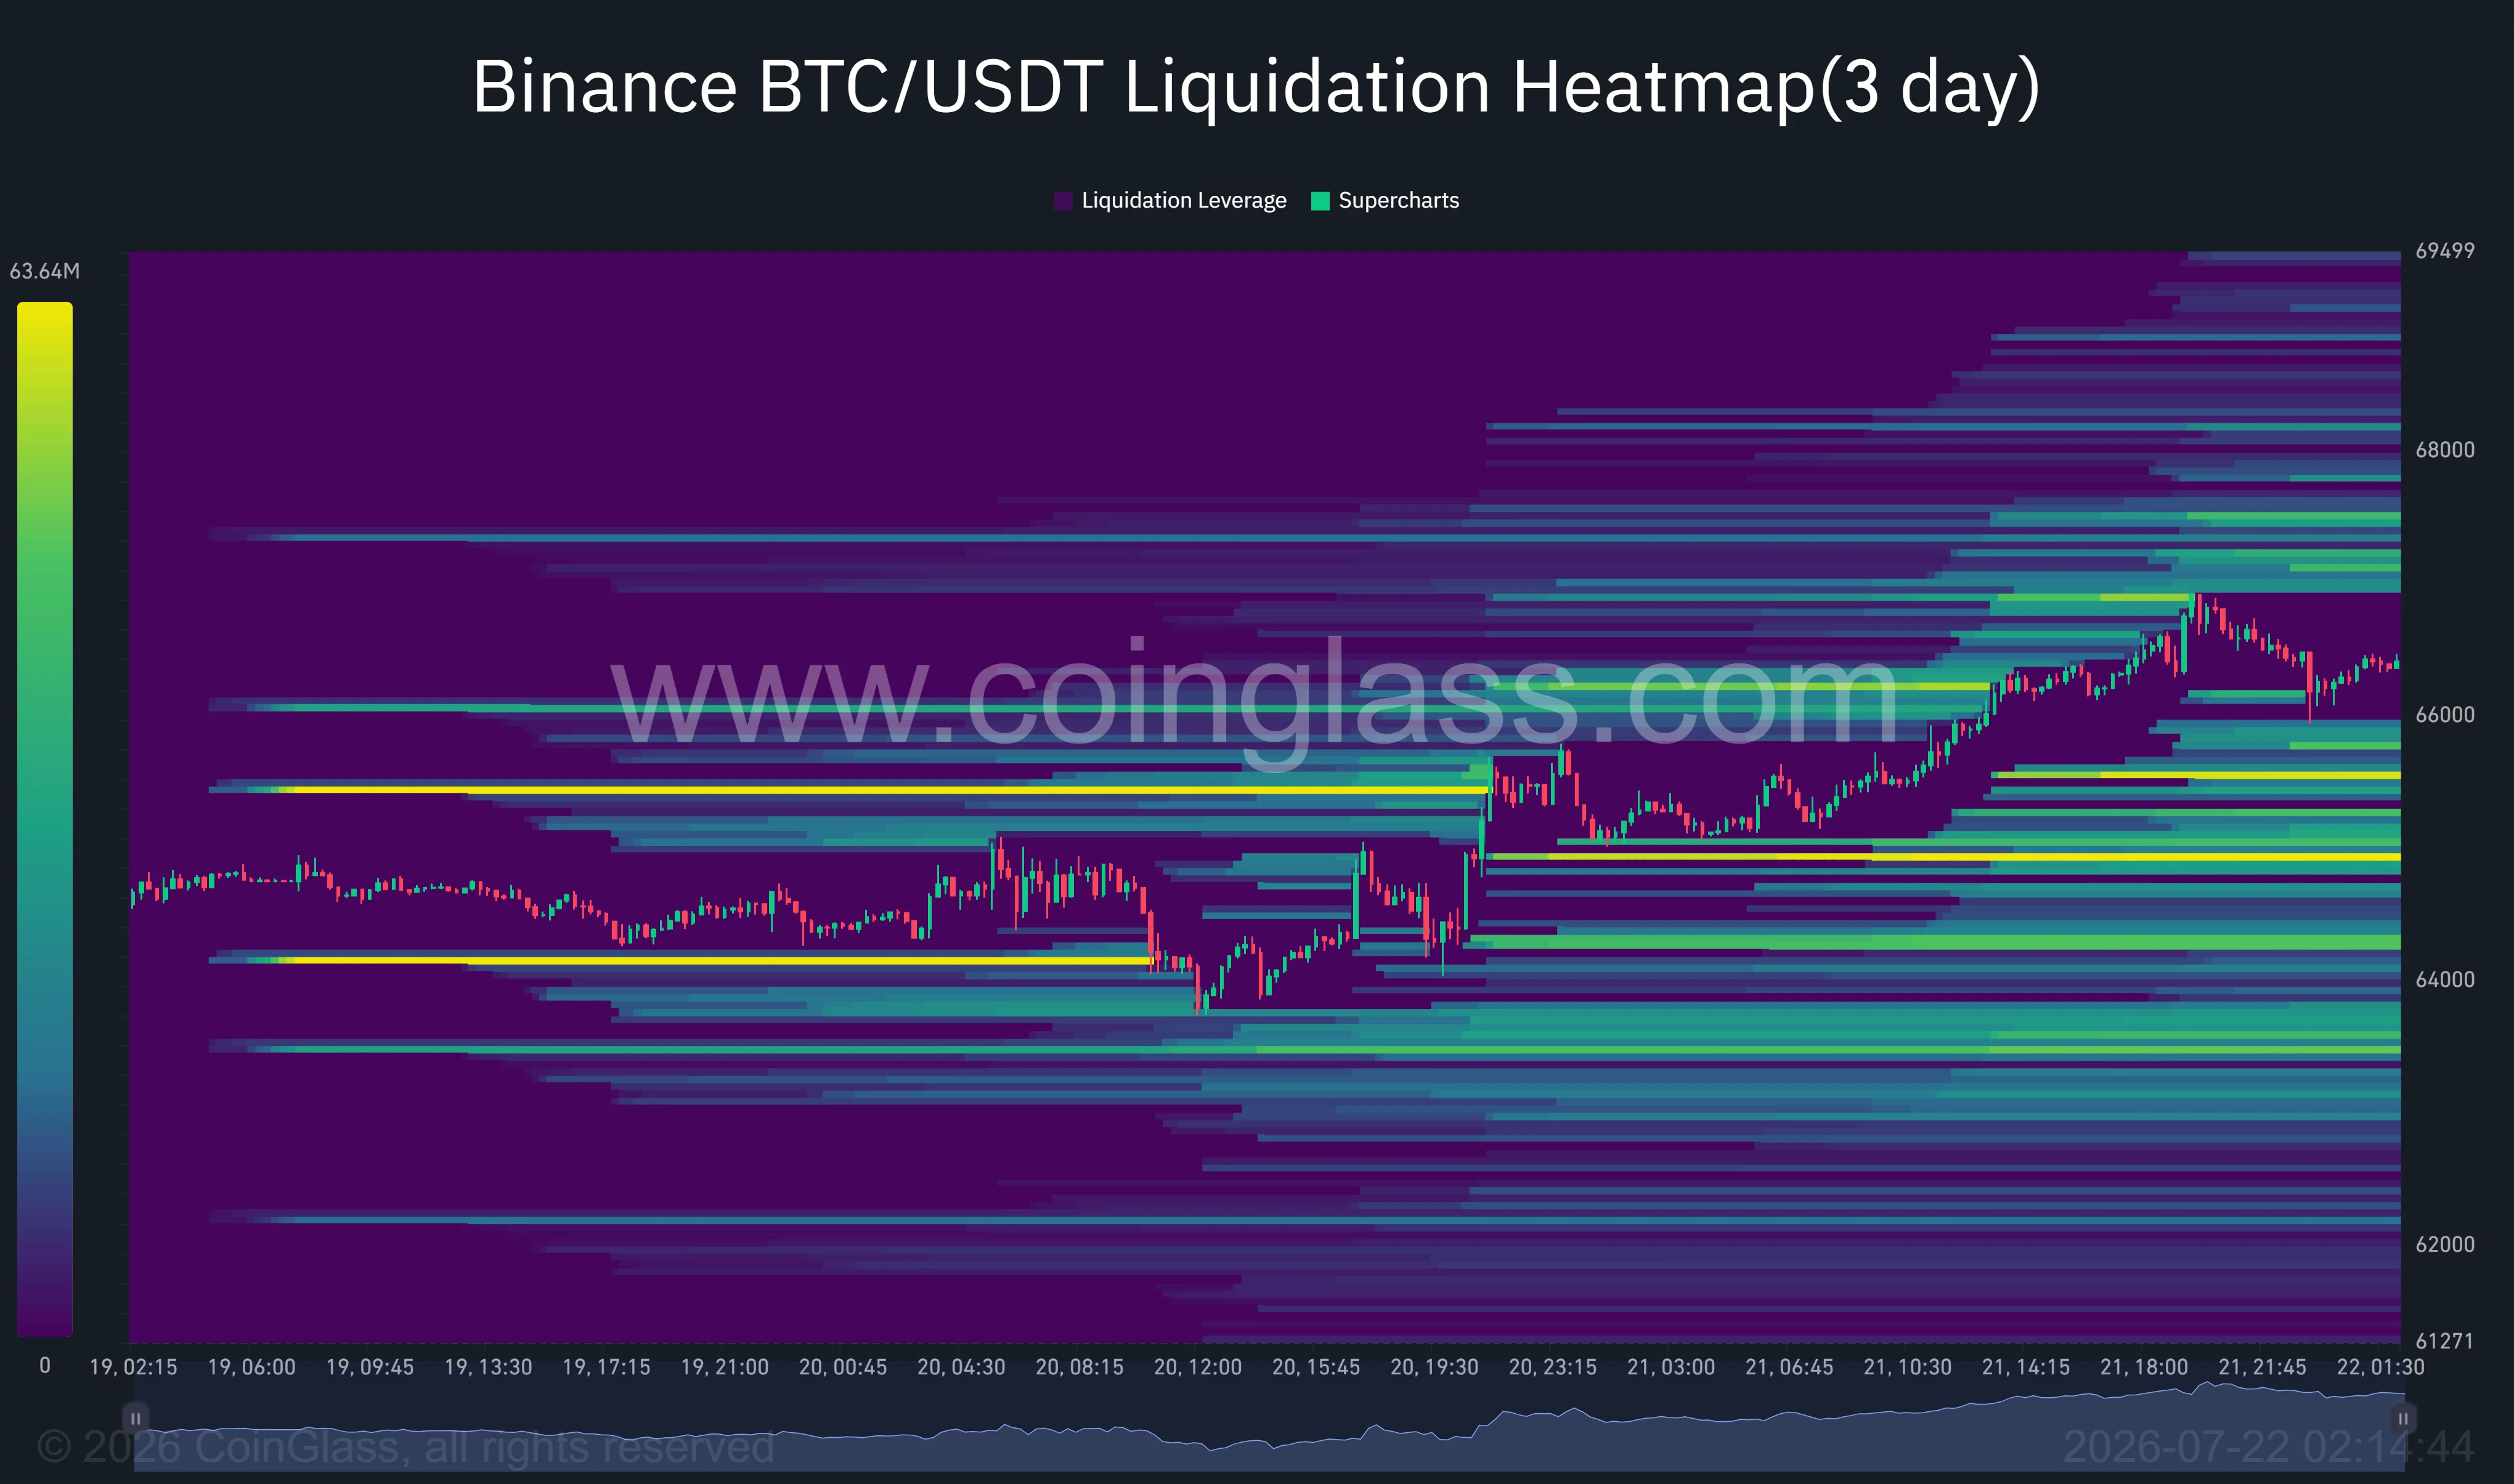
CoinGlass’ three-day liquidation heatmap places the closest overhead leverage around $66,800 to $67,300, with another concentration near $68,000. A move through those levels could force additional short closures. Below price, liquidation pools appear around $65,300, $64,800, and $64,200.

The bullish case would weaken if BTC closes below the channel floor and loses the daily Bollinger midpoint near $63,800. Such a breakdown could expose the lower daily band at $61,578, while renewed oil gains, further military escalation, or declining ETF inflows would add pressure. Bitcoin must therefore convert $67,000 into support before the latest recovery can extend toward $70,000.
Disclosure: This article does not represent investment advice. The content and materials featured on this page are for educational purposes only.