
Bitcoin price has slipped back toward $85,500 on Oct. 6 after another rejection near $87,000, leaving buyers defending a dense support area while the market sits roughly 32% below its record high exactly one year later.
Summary
- Bitcoin trades roughly 32% below its record high one year after reaching $126,080 in 2025.
- U.S. spot Bitcoin ETFs lost $89.9 million Monday, reversing two consecutive sessions of net inflows.
- Bitcoin has repeatedly failed near $87,000, leaving $86,700 as the main breakout level for buyers.
- Ali Martinez says 1.59 million BTC changed hands between $83,300 and $84,600, creating major support.
- Weekly RSI near 64 remains below overbought territory while price approaches the upper Bollinger Band.
CoinGecko data puts BTC near $85,500 at the latest reading, with a 24-hour range of roughly $85,010 to $86,662 and a market value close to $1.72 trillion. BTC reached its $126,080 all-time high on Oct. 6, 2025, leaving the current price 32.2% below the record.
The pullback followed another attempt to clear $87,000. The crypto has tested that area several times since late September without establishing a sustained break, making the narrow range between low-$83,000 support and high-$86,000 resistance the main technical battleground.
Bitcoin price keeps running into sellers near $87K
Bitcoin has spent much of the past two weeks moving between roughly $83,000 and $87,000. CoinGecko’s seven-day range stretches from $82,911 to $87,086, confirming that buyers and sellers have repeatedly taken control near opposite ends of the same zone.
Crypto analyst Daan Crypto Trades said the $85,000 area has repeatedly acted as both support and resistance. He identified a cluster of lower highs above $87,000 and another liquidity area around $83,000, arguing that a break from either side could produce a stronger price move.
Ali Martinez has narrowed the structure further. In his Oct. 6 analysis, he said BTC has built support between $83,300 and $84,600, where his Glassnode URPD data showed roughly 1.59 million BTC changing hands.
Martinez identified $86,700 as the level buyers need to clear. His analysis showed no similarly dense supply concentration above that point until around $105,000. He said a successful break could put $100,000 back into focus, although that remains a conditional analyst scenario and not a price forecast guaranteed by the on-chain data.
The same resistance area has appeared in recent institutional analysis. As crypto.news previously reported, Bitfinex analysts identified $86,500 as a key hurdle for Bitcoin after the token briefly reached $87,220 on Oct. 2. Their analysis said sustained buying above the level would strengthen the recovery.
Bitcoin’s $85K support is being tested as ETF demand cools
Institutional fund flows weakened at the start of the week.
U.S. spot Bitcoin ETFs recorded $89.9 million in net outflows on Oct. 5 after taking in around $293 million during the previous two October trading sessions. Total trading volume across the funds reached $2.18 billion Monday, according to SoSoValue data.

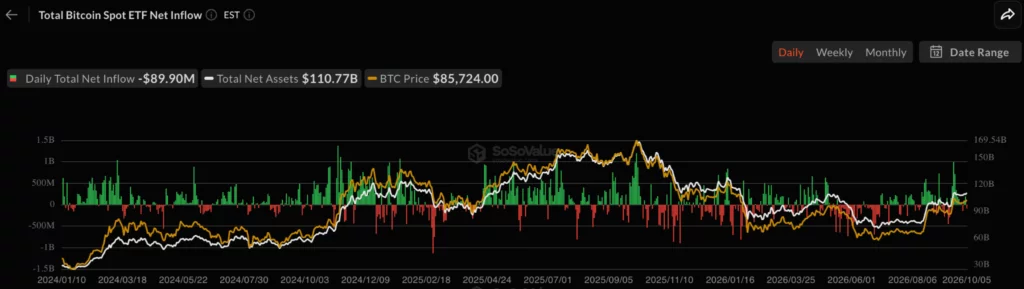
BlackRock’s IBIT was the only fund with a net inflow, attracting approximately $69.9 million. ARK Invest and 21Shares’ ARKB recorded the largest withdrawal at roughly $85.2 million. Total spot Bitcoin ETF assets stood near $110.8 billion, while cumulative net inflows were approximately $57.7 billion.
The latest withdrawal interrupted two positive sessions but does not erase September’s stronger fund demand. In related coverage, crypto.news reported that Bitcoin ETFs had recently helped support the recovery above $85,000, while rising futures leverage created another source of volatility.
ETF demand remains relevant because recent rallies have struggled to hold after fund buying slows. Crypto.news previously reported that Bitcoin’s October breakout still required stronger spot demand to extend toward the high-$90,000s.
The anniversary of BTC’s record provides another point of comparison. At roughly 32% below $126,080, the current gap from the peak is far smaller than BTC’s completed peak-to-trough declines following earlier cycle highs. BlackRock’s iShares research records drawdowns of roughly 80% after the 2014 peak, 83% after the 2017 high and 77% following the 2021 top.
Those figures describe completed historical drawdowns and do not establish how deep the current cycle will eventually become.
Weekly indicators still favor buyers below $89K
Bitcoin’s weekly indicators remain constructive despite repeated failures near $87,000.
The Bollinger Bands place the weekly middle band around $71,035 and the upper band near $89,065, with Bitcoin trading in the upper half of the channel. Price therefore remains above the midpoint but is getting closer to the upper band, where further gains would bring BTC into an area associated with stronger momentum and increased risk of consolidation.

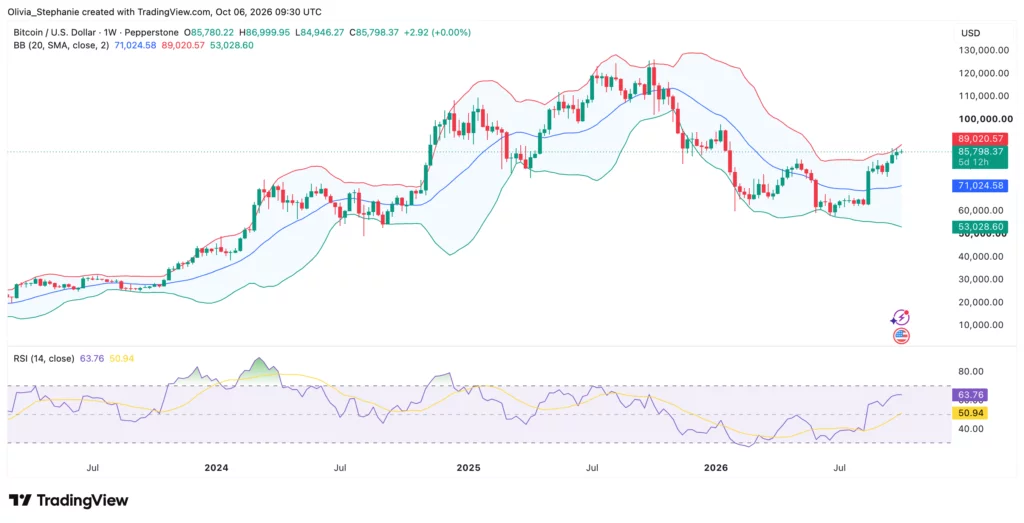
Weekly RSI stands near 63.95 compared with its moving average around 50.96. The indicator remains below the traditional 70 overbought level, leaving momentum positive without showing the same stretched reading normally associated with an overbought weekly market.
Trader Lennaert Snyder said he was watching whether BTC could hold around $84,900 before another attempt at the $87,200 highs. His shorter-term setup identified $84,400 as a downside target if buyers fail, with $82,500 as a lower level in his bearish scenario.
Those targets remain trading scenarios. The more established on-chain range from Martinez places the first important support between $83,300 and $84,600, while $86,700 remains the immediate breakout point.
Martinez separately said large BTC holders had added more than 14,335 BTC since Oct. 1, valued at roughly $1.22 billion at the prices used in his analysis. He attributed the data to Santiment. The reported accumulation supports his bullish thesis, though large-holder activity alone does not establish the next direction for BTC.
Trump’s proposed $5,000 payment remains uncertain
A separate bullish scenario circulating among crypto traders centers on President Donald Trump’s proposed $5,000 payment to U.S. adults if Republicans retain control of Congress in the Nov. 3 midterm elections.
Reuters reported that roughly 240 million U.S. adults could qualify under Trump’s description, putting the estimated cost near $1.2 trillion. Congress would have to approve the spending, and several Republican lawmakers have raised concerns about inflation and the federal deficit.
Crypto analyst Crypto Rover argued that even a small allocation of such payments into digital assets could create substantial crypto demand. Using a 5% to 10% allocation assumption against an estimated $1.2 trillion to $1.3 trillion program would produce roughly $60 billion to $130 billion in hypothetical investment flows.
No evidence shows recipients would allocate that share to Bitcoin or crypto, and the payment itself has not been approved. Rover’s numbers are therefore a scenario built on several conditions, including Republican control of Congress, congressional authorization, actual distribution and recipients choosing to invest part of the money.
Reuters notes that Congress controls federal spending and that most legislation requires 60 Senate votes unless lawmakers use a budget process that allows passage under different rules. The Nov. 3 election will determine whether Republicans retain their current control of both chambers.
Before then, Bitcoin traders face another scheduled U.S. policy event. The Federal Reserve’s next meeting is set for Oct. 27–28, with recent crypto.news analysis noting that Treasury yields, inflation expectations and ETF demand remain among the factors traders are watching around Bitcoin’s current range. Crypto.news’ October Bitcoin price analysis
Disclosure: This article does not represent investment advice. The content and materials featured on this page are for educational purposes only.