

Solana price pulled back on Wednesday as bullish momentum weakened near a key Fibonacci resistance zone, while traders monitored signs of a potential bearish MACD crossover on the daily chart.
Summary
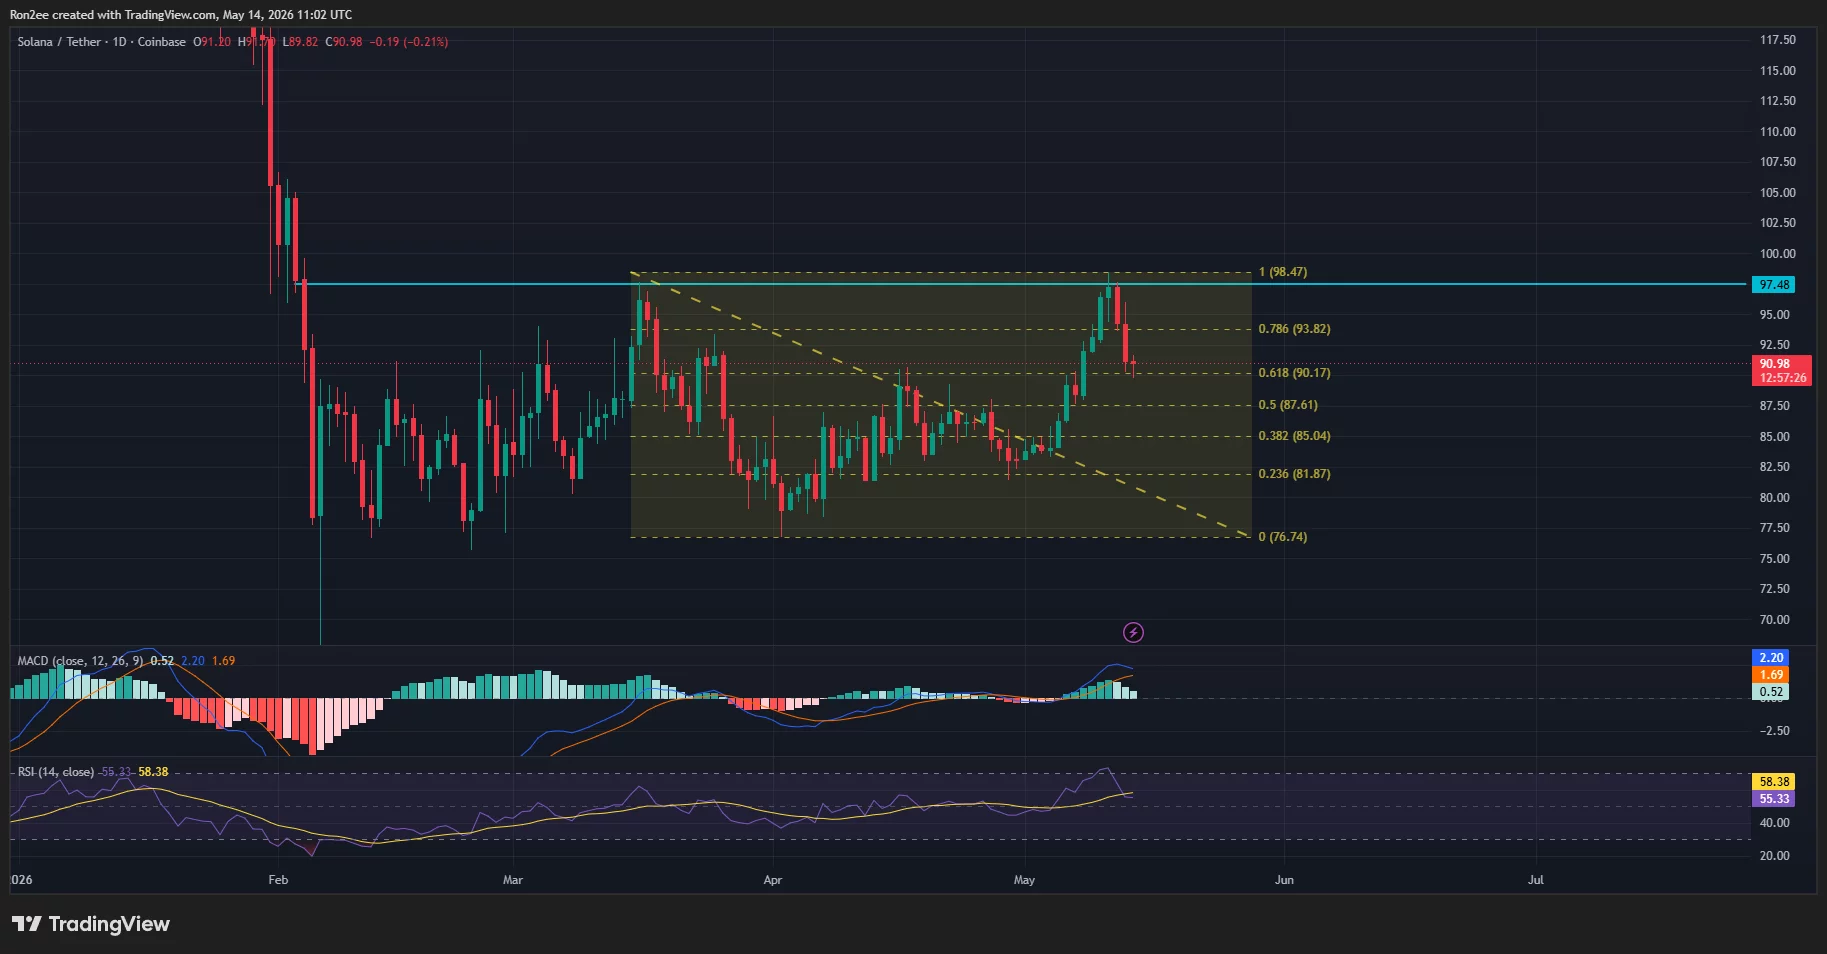
- Solana price pulled back toward the $90 support zone after facing rejection near the $94–$98 Fibonacci resistance region.
- The MACD indicator is approaching a bearish crossover on the daily chart, signaling weakening bullish momentum after SOL’s recent rally.
- Analysts are watching whether bulls can defend the $90 support level to prevent a deeper correction toward the $87 and $85 regions.
According to data from crypto.news, Solana (SOL) traded near $91 at press time on May 14 after falling from this week’s local high around $97.5. The token remains up sharply from its April lows near $76, though recent price action suggests bullish momentum may be starting to cool after the strong multi-week rally.
Solana’s rebound over the past several weeks was largely driven by improving sentiment across the broader crypto market alongside growing optimism surrounding the network’s upcoming Alpenglow upgrade and Firedancer validator developments. Renewed activity across Solana-based decentralized finance protocols and memecoin trading also helped support demand for the token.
At the same time, derivatives sentiment had strengthened notably during the recent rally, with SOL futures open interest climbing alongside positive funding rates, signaling aggressive bullish positioning from leveraged traders.
However, the latest pullback emerged after SOL faced rejection near the key Fibonacci resistance zone between the 0.786 retracement at $93.82 and the recent swing high near $98.47.
On the daily chart, Solana continues trading above the important 0.618 Fibonacci retracement support near $90.17, which now acts as the key short-term support level bulls must defend to prevent a deeper correction.
Despite the recent rejection, the broader structure still remains moderately constructive as SOL continues forming higher lows since April while holding well above the major support region between $76 and $82, where buyers previously stepped in aggressively during earlier sell-offs.
However, momentum indicators suggest bullish strength may be weakening. Notably, the MACD histogram has started declining after a strong expansion phase earlier this month, while the MACD line itself appears to be gradually approaching a bearish crossover with the signal line. Such a crossover often indicates slowing upside momentum and can precede short-term corrective phases if selling pressure accelerates.
Meanwhile, the Relative Strength Index has also started cooling from near-overbought territory and currently sits around the neutral 55–58 range, suggesting bullish momentum is fading but has not yet fully reversed.
If Solana loses the key $90 support level, sellers could attempt to push the token toward the next major support zones near $87.6 and $85, both of which align with important Fibonacci retracement levels and previous consolidation regions.
On the upside, bulls would likely need to reclaim the $94–$96 resistance area to invalidate the short-term bearish setup and restore momentum toward the psychological $100 level. A successful breakout above $100 could potentially open the door for a move toward the $103 and $106 resistance zones in the near term.
For now, traders remain focused on whether Solana can stabilize above the key $90 support region as momentum indicators continue flashing early warning signs of a possible trend slowdown.
Disclosure: This article does not represent investment advice. The content and materials featured on this page are for educational purposes only.


Leave feedback about this