

Mantra’s price bounced back this week, with the ongoing drop in exchange balances signaling more potential gains.
Mantra (OM), a leading player in the Real World Asset or RWA) tokenization, rose to a high of $7 on Tuesday, up by almost 20% from its lowest level this month.
A key catalyst for the token is the continued decline in centralized exchange balances this week.
Data from Nansen shows that OM tokens held on exchanges have dropped over 7% in the past seven days to 345.94 million, down from more than 372 million a week ago. The total supply of OM on exchanges has fallen nearly 3% to 38.92%.

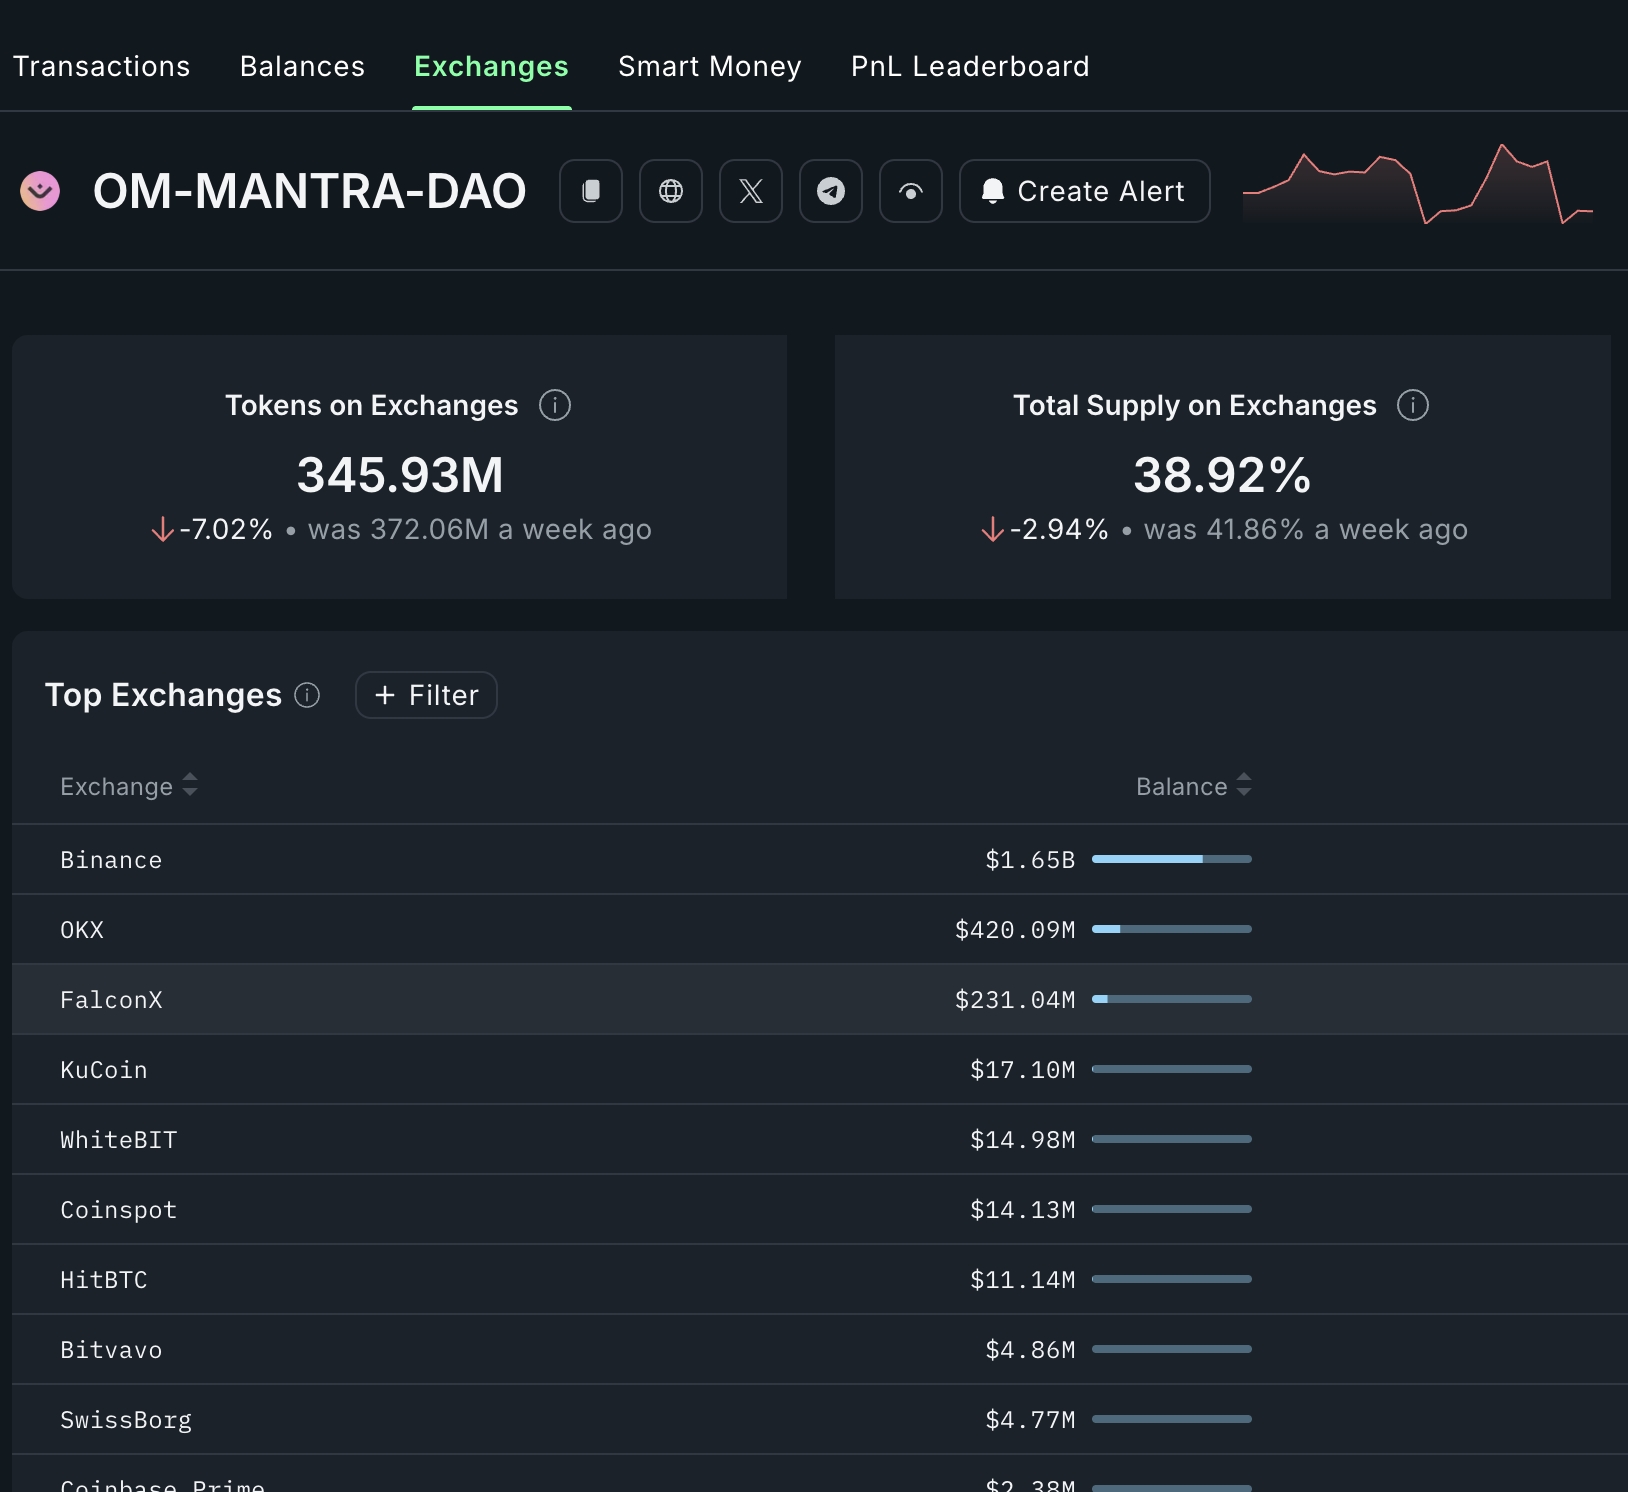
A decline in exchange reserves indicates that holders are not selling their tokens but are instead moving them to self-custody wallets.
Additional data shows that Mantra’s open interest in the futures market is increasing. According to CoinGlass, open interest has climbed to over $356 million, up from this month’s low of $319 million. Rising open interest is typically a sign that investors are optimistic about the token’s future.
Mantra price rose as the developers continued their investigations on malicious actors ahead of the GenDrop airdrop. GenDrop is a process where active members of the community will receive OM allocations. In a note, the developers removed 123,195 accounts, while 80,000 wallets are unallocated.
Mantra has become one of the best-performing cryptocurrencies since 2024, with its price surging from near zero to almost $10. This rally reflects growing confidence in MantraChain, which developers have positioned as the fastest and cheapest layer-1 network for RWA tokenization.
Mantra has also received a license to operate an exchange in Dubai. It also won a deal to tokenize assets worth over $1 billion for a large real estate company in the United Arab Emirates.
Mantra price analysis

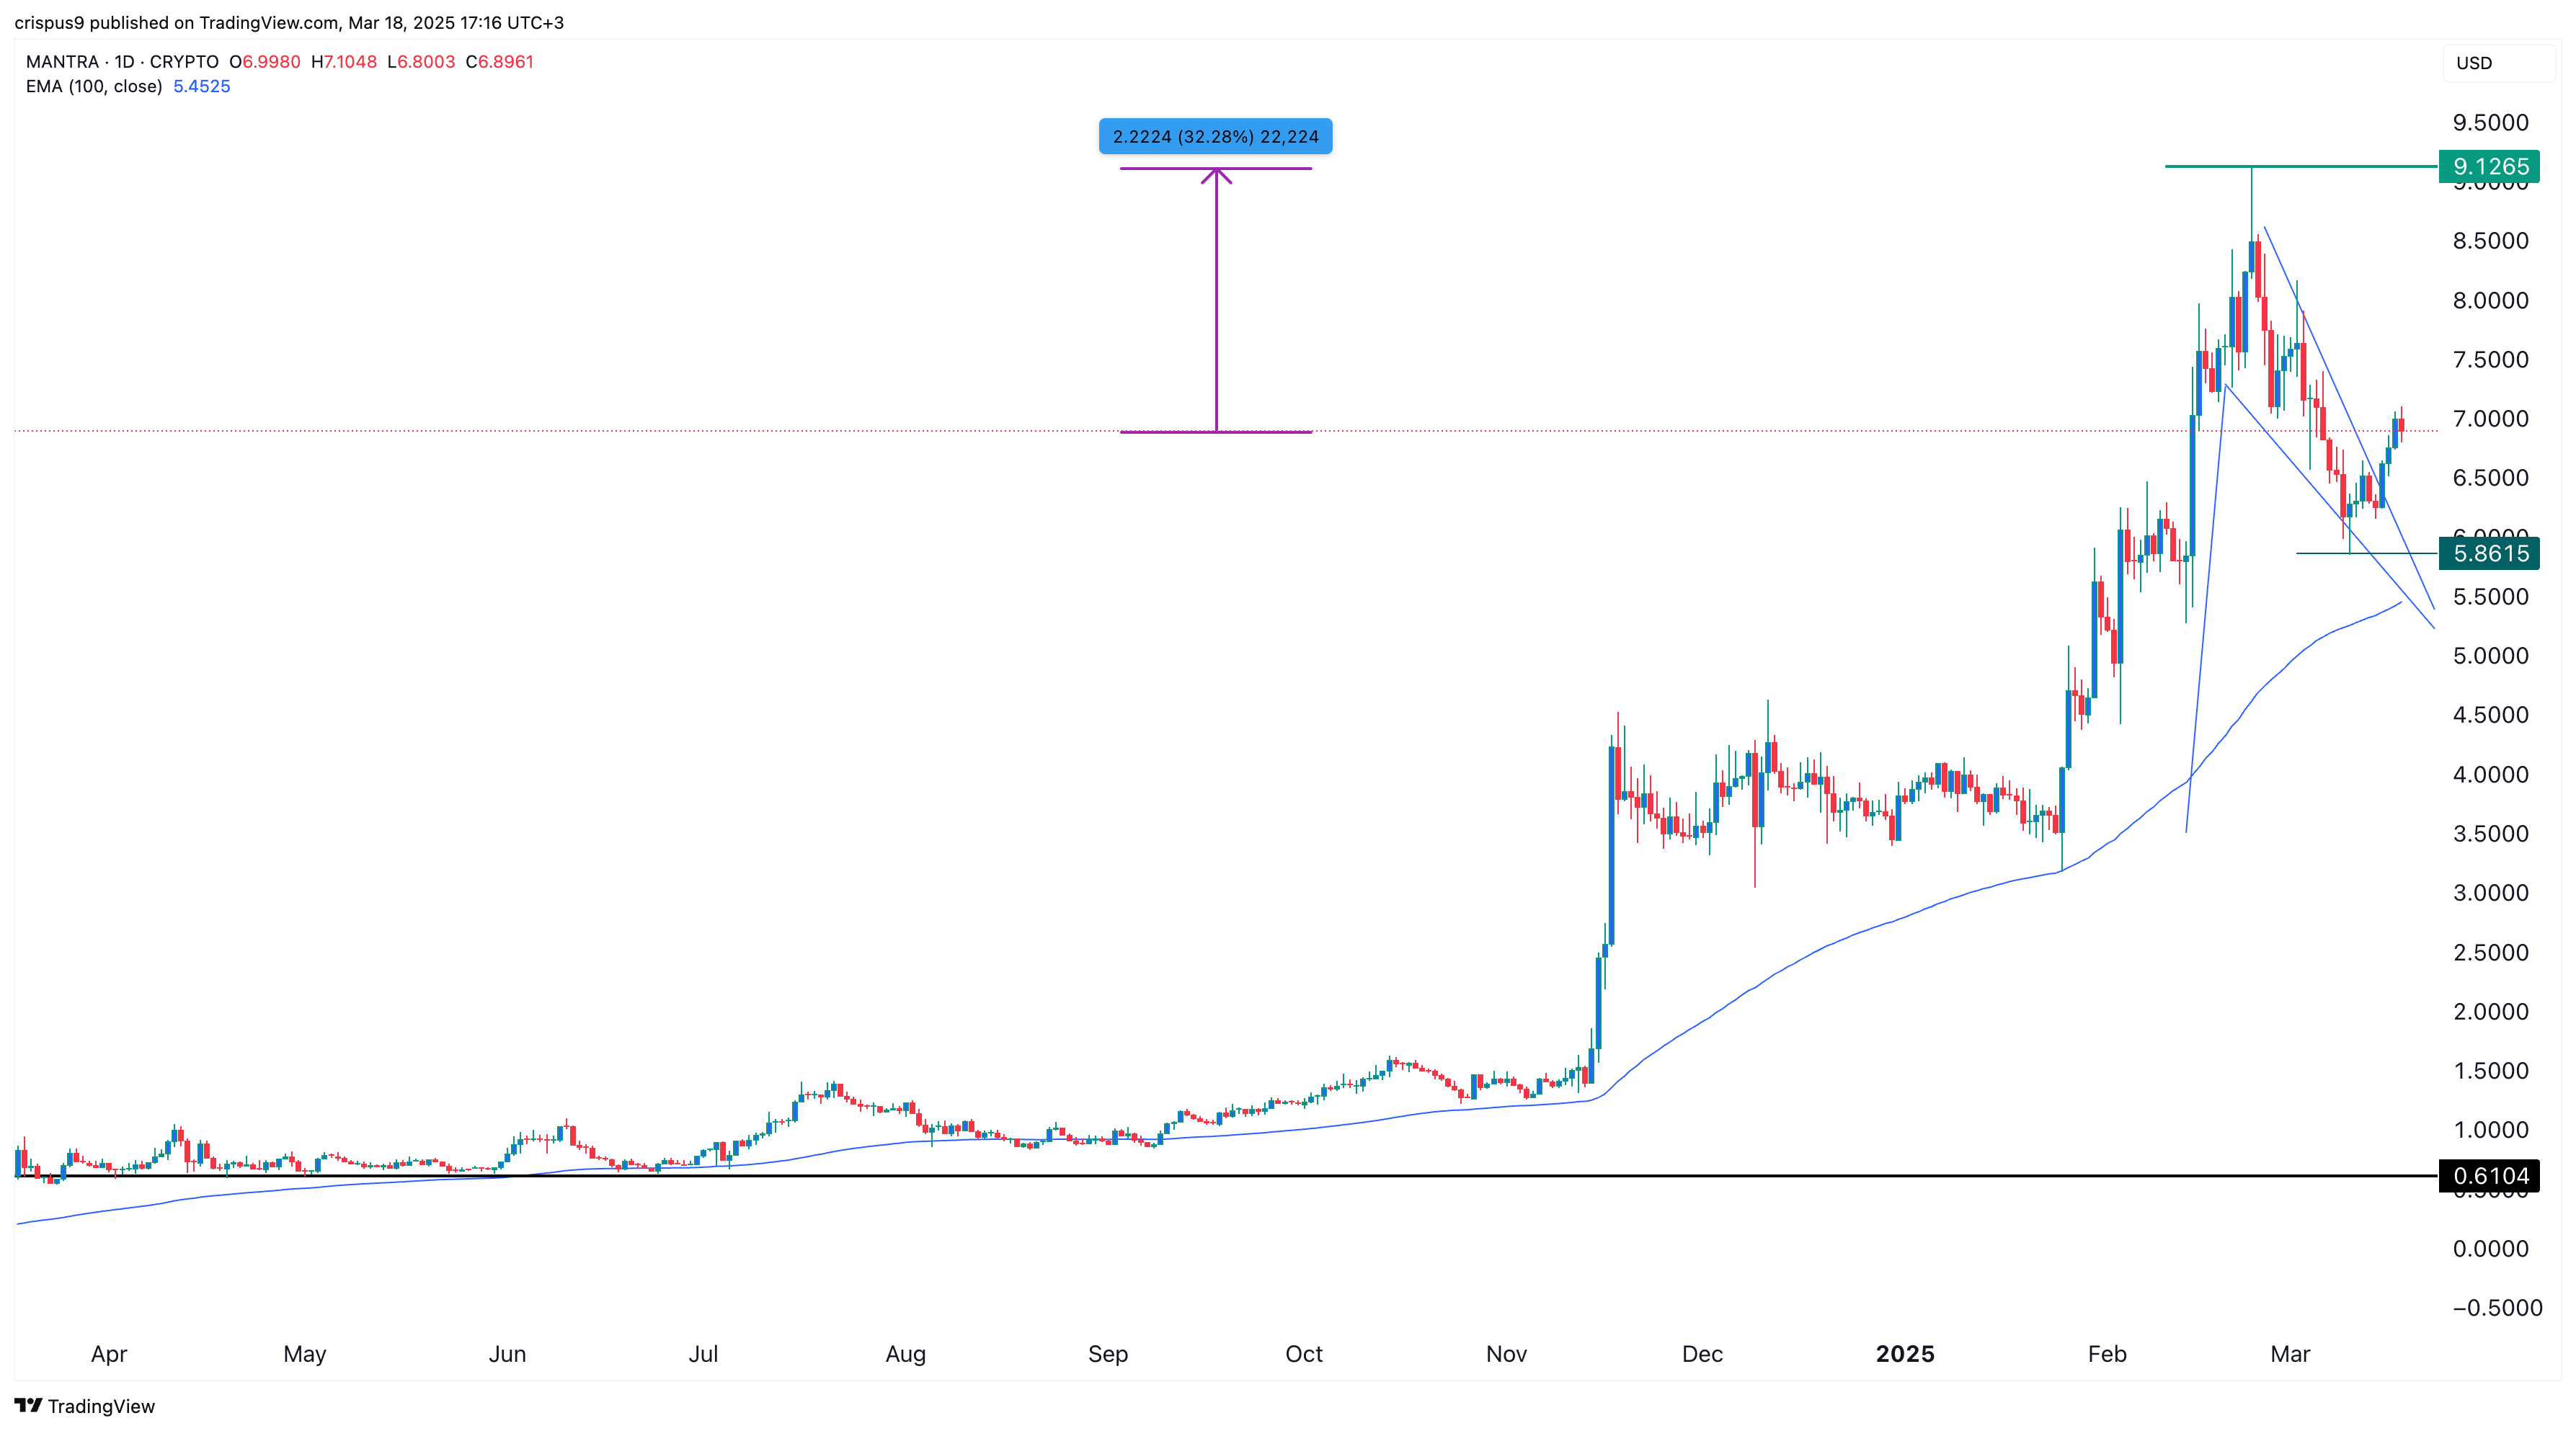
The daily chart shows that OM’s price bottomed at $5.86 on March 10 and has since rebounded to $6.90.
This rebound followed the formation of a falling wedge pattern, which consists of two descending and converging trendlines. Mantra also formed a bullish pennant chart pattern, characterized by a vertical line and a triangle formation.
OM also found support at the 100-day moving average. Therefore, there’s a strong chance that the token could rebound to its all-time high of $9.12, about 32% above the current level. A move above that level could pave the way for more gains, potentially reaching the psychological level of $10.