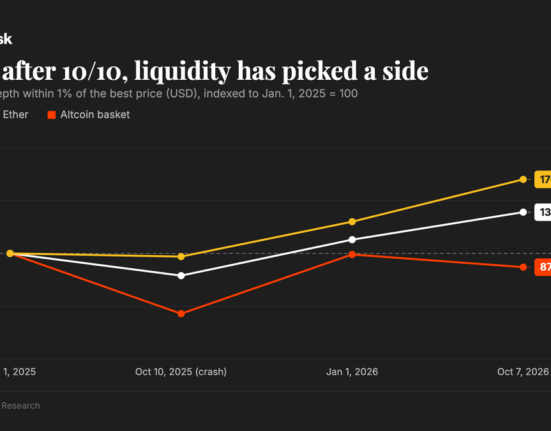
Bitcoin price has rebounded toward $82,800 after a sharp liquidation-driven sell-off, but resistance near $84,400 stands between its weekend recovery and another attempt at $87,000.
Summary
- Bitcoin price traded near $82,726, down 2.2% over seven days, according to CoinGecko.
- Daily RSI stood at 50.97, while Bitcoin remained below its $84,396 Bollinger Band midpoint.
- U.S. spot Bitcoin ETFs recorded $678.9 million in net outflows across Oct. 5–9.
- Trader Lennaert Snyder identified $81,100 as a key support level for the rebound.
CoinGecko recorded Bitcoin at $82,726 on Oct. 10, up 0.3% over 24 hours following its retreat from the week’s highs. Its seven-day range stretched from $80,427 to $86,949, putting the latest price roughly 2.9% above the period’s low but still below the resistance that stopped earlier rallies.
The Binance TradingView charts placed BTC slightly higher, near $82,790, with the recovery approaching its short-term moving average while remaining below several longer averages.
The rebound followed a sell-off that produced $1.09 billion in market-wide crypto liquidations over 24 hours to Oct. 9, according to CoinGlass figures. Long positions accounted for $1.05 billion, while Bitcoin briefly reached $80,350 on Bitstamp before recovering.
Bitcoin price faces a resistance wall near $84,400
Bitcoin’s 4-hour chart shows price near $82,794, just above the 20-period simple moving average at $82,766. The rebound has returned BTC to that short-term trend line after the sharp decline from the $86,000–$87,000 area.

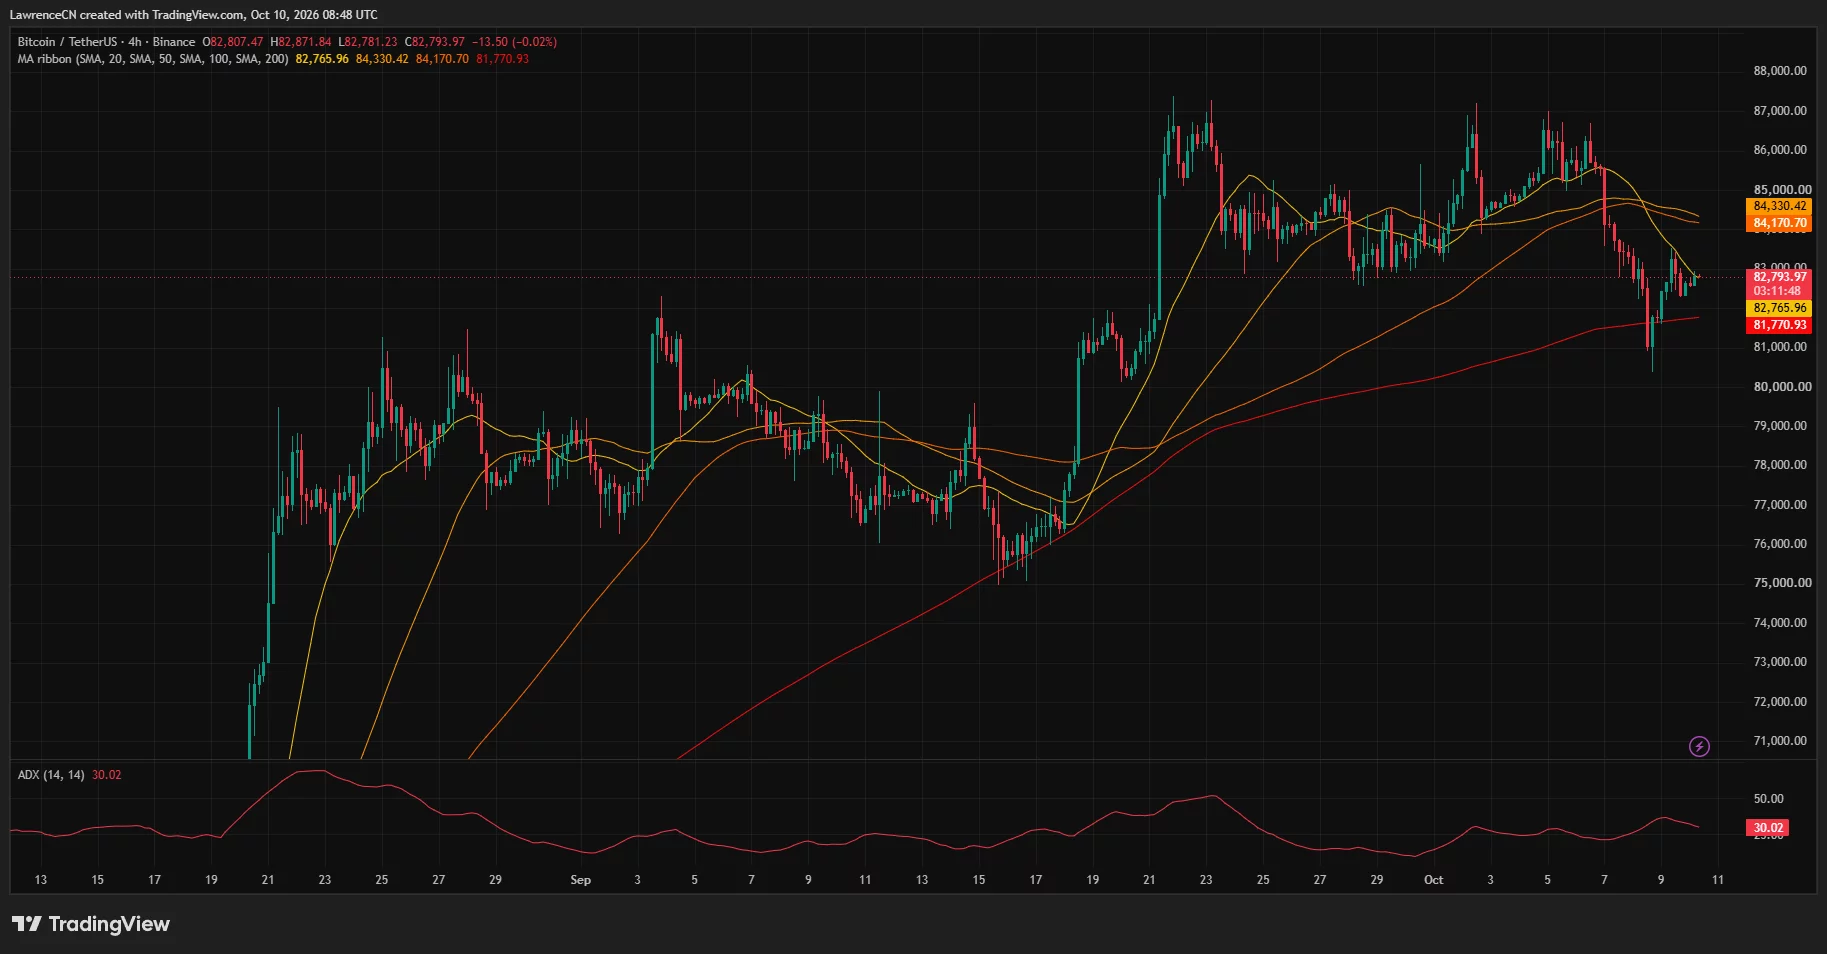
The larger moving averages remain overhead. TradingView places the 100-period average at $84,171 and the 50-period average at $84,330, creating a narrow resistance cluster roughly 1.7%–1.9% above the chart price.
The daily chart adds another nearby level. Its Bollinger Band midpoint, which represents the 20-day moving average, stands at $84,396, almost directly above the two 4-hour averages.
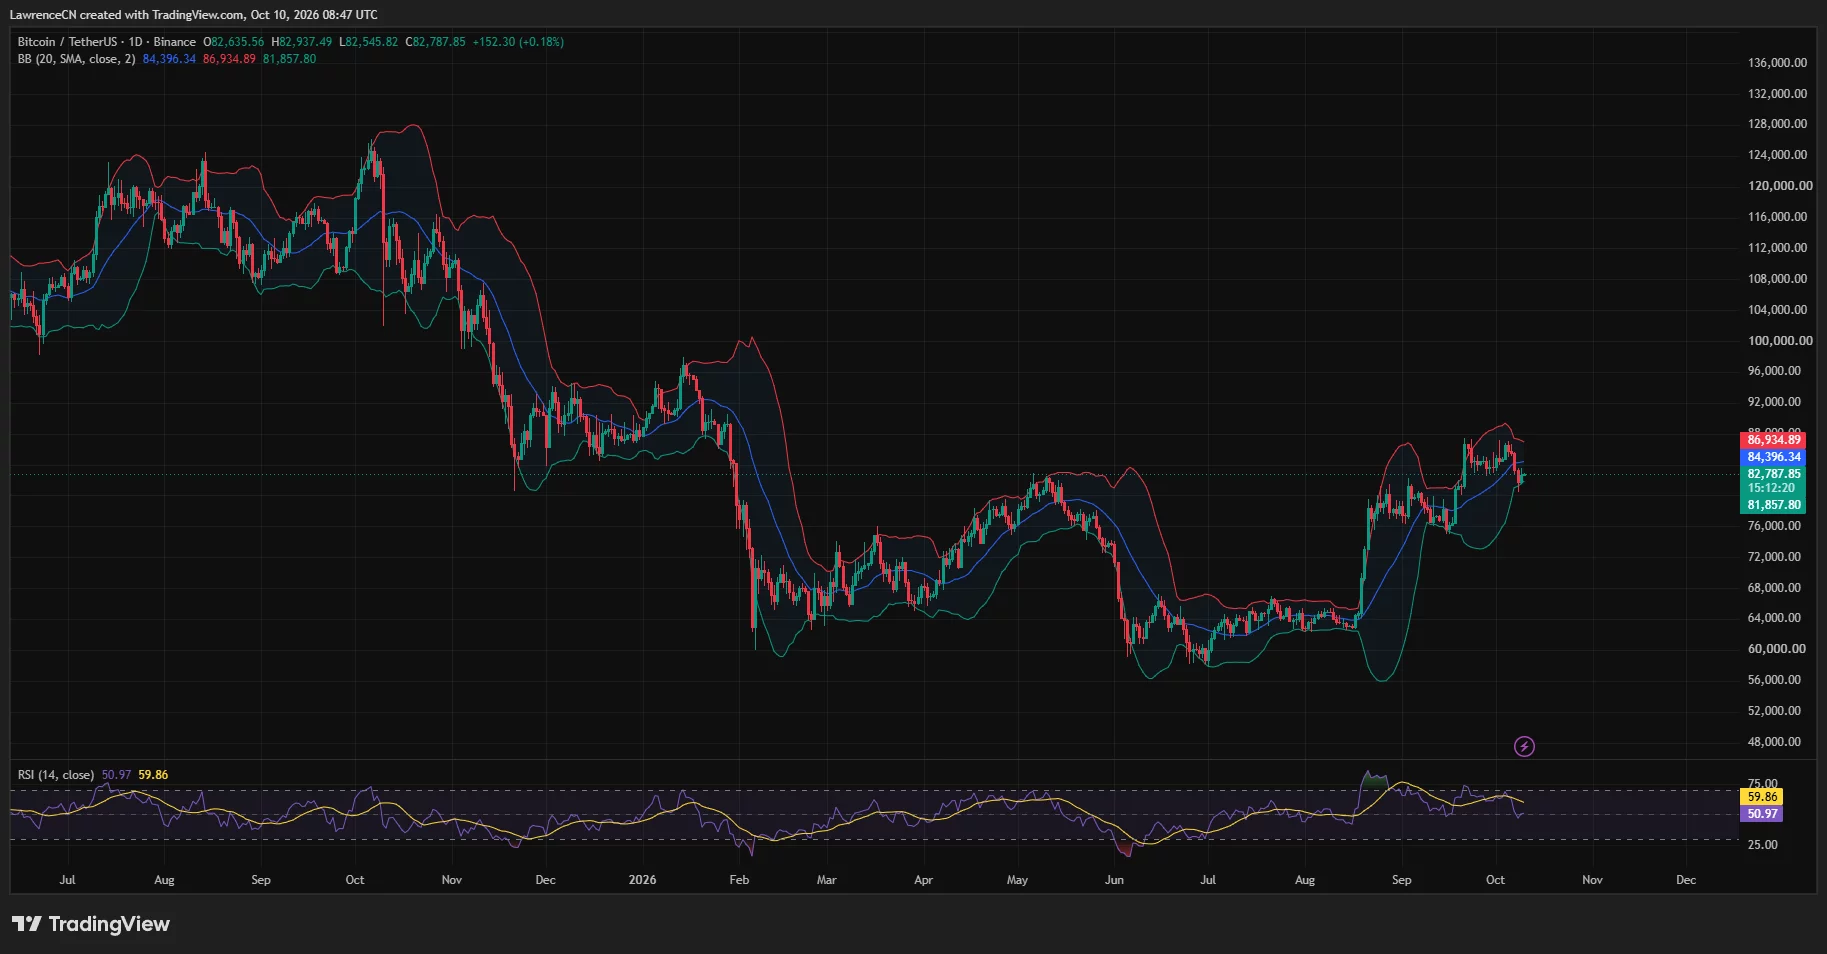
Together, the TradingView readings place several separate technical hurdles within the $84,170–$84,400 range. Bitcoin remains below all three despite recovering more than $2,000 from its recent low.
The daily upper Bollinger Band sits at $86,935, close to the $87,000 area that repeatedly capped price in late September and early October. Crypto.news previously covered Bitcoin’s repeated $87K rejections before the latest breakdown.
Daily momentum has also cooled. The relative strength index stands at 50.97, below its average of 59.86 and well below the stronger readings reached during the September advance.
The 4-hour average directional index reads 30.02 after rising during the recent decline. Price has recovered toward the shortest moving average, but the chart still shows the longer averages above it and the latest rally below the early-October highs.
Analysts put $81,100 at the center of the rebound
Trader Lennaert Snyder said Bitcoin began its weekend consolidation after bouncing from the $81,000 area. His analysis identified $81,100 as the last major support for the bounce to develop into a reversal on a higher timeframe.
Snyder placed the recent low near $80,400 beneath that level. He said holding the low into the following week would improve the chances of a move toward the liquidity around $87,000.
His upside scenario requires Bitcoin to overcome nearer resistance first. The trader identified $84,000 and a 4-hour chart gap around $84,000–$85,000 as obstacles before another test of the highs.
Snyder also cautioned that weekend moves often reverse during the following week. He expected a relatively quiet Saturday, with potential movement on Sunday, while keeping his bullish scenario conditional on support holding.
The TradingView charts place two additional levels between the current price and Snyder’s downside threshold. Bitcoin’s 4-hour 200-period moving average stands at $81,771, while the daily lower Bollinger Band sits at $81,858.
Both readings fall within roughly $90 of each other, concentrating the nearest technical support around $81,800. Below that area, Snyder’s $81,100 threshold and the recent $80,400 low become the next reference points in his setup.
The trader said losing the low would leave Bitcoin vulnerable to another decline, with his attention then shifting to potential entries below $80,000.
Liquidation concentrations remain above the market
CoinGlass’s one-week liquidation heatmap shows its brightest remaining overhead concentration around $87,000–$87,300. Another visible band sits near $84,700–$84,800, with additional concentrations around $84,000 and $88,000.

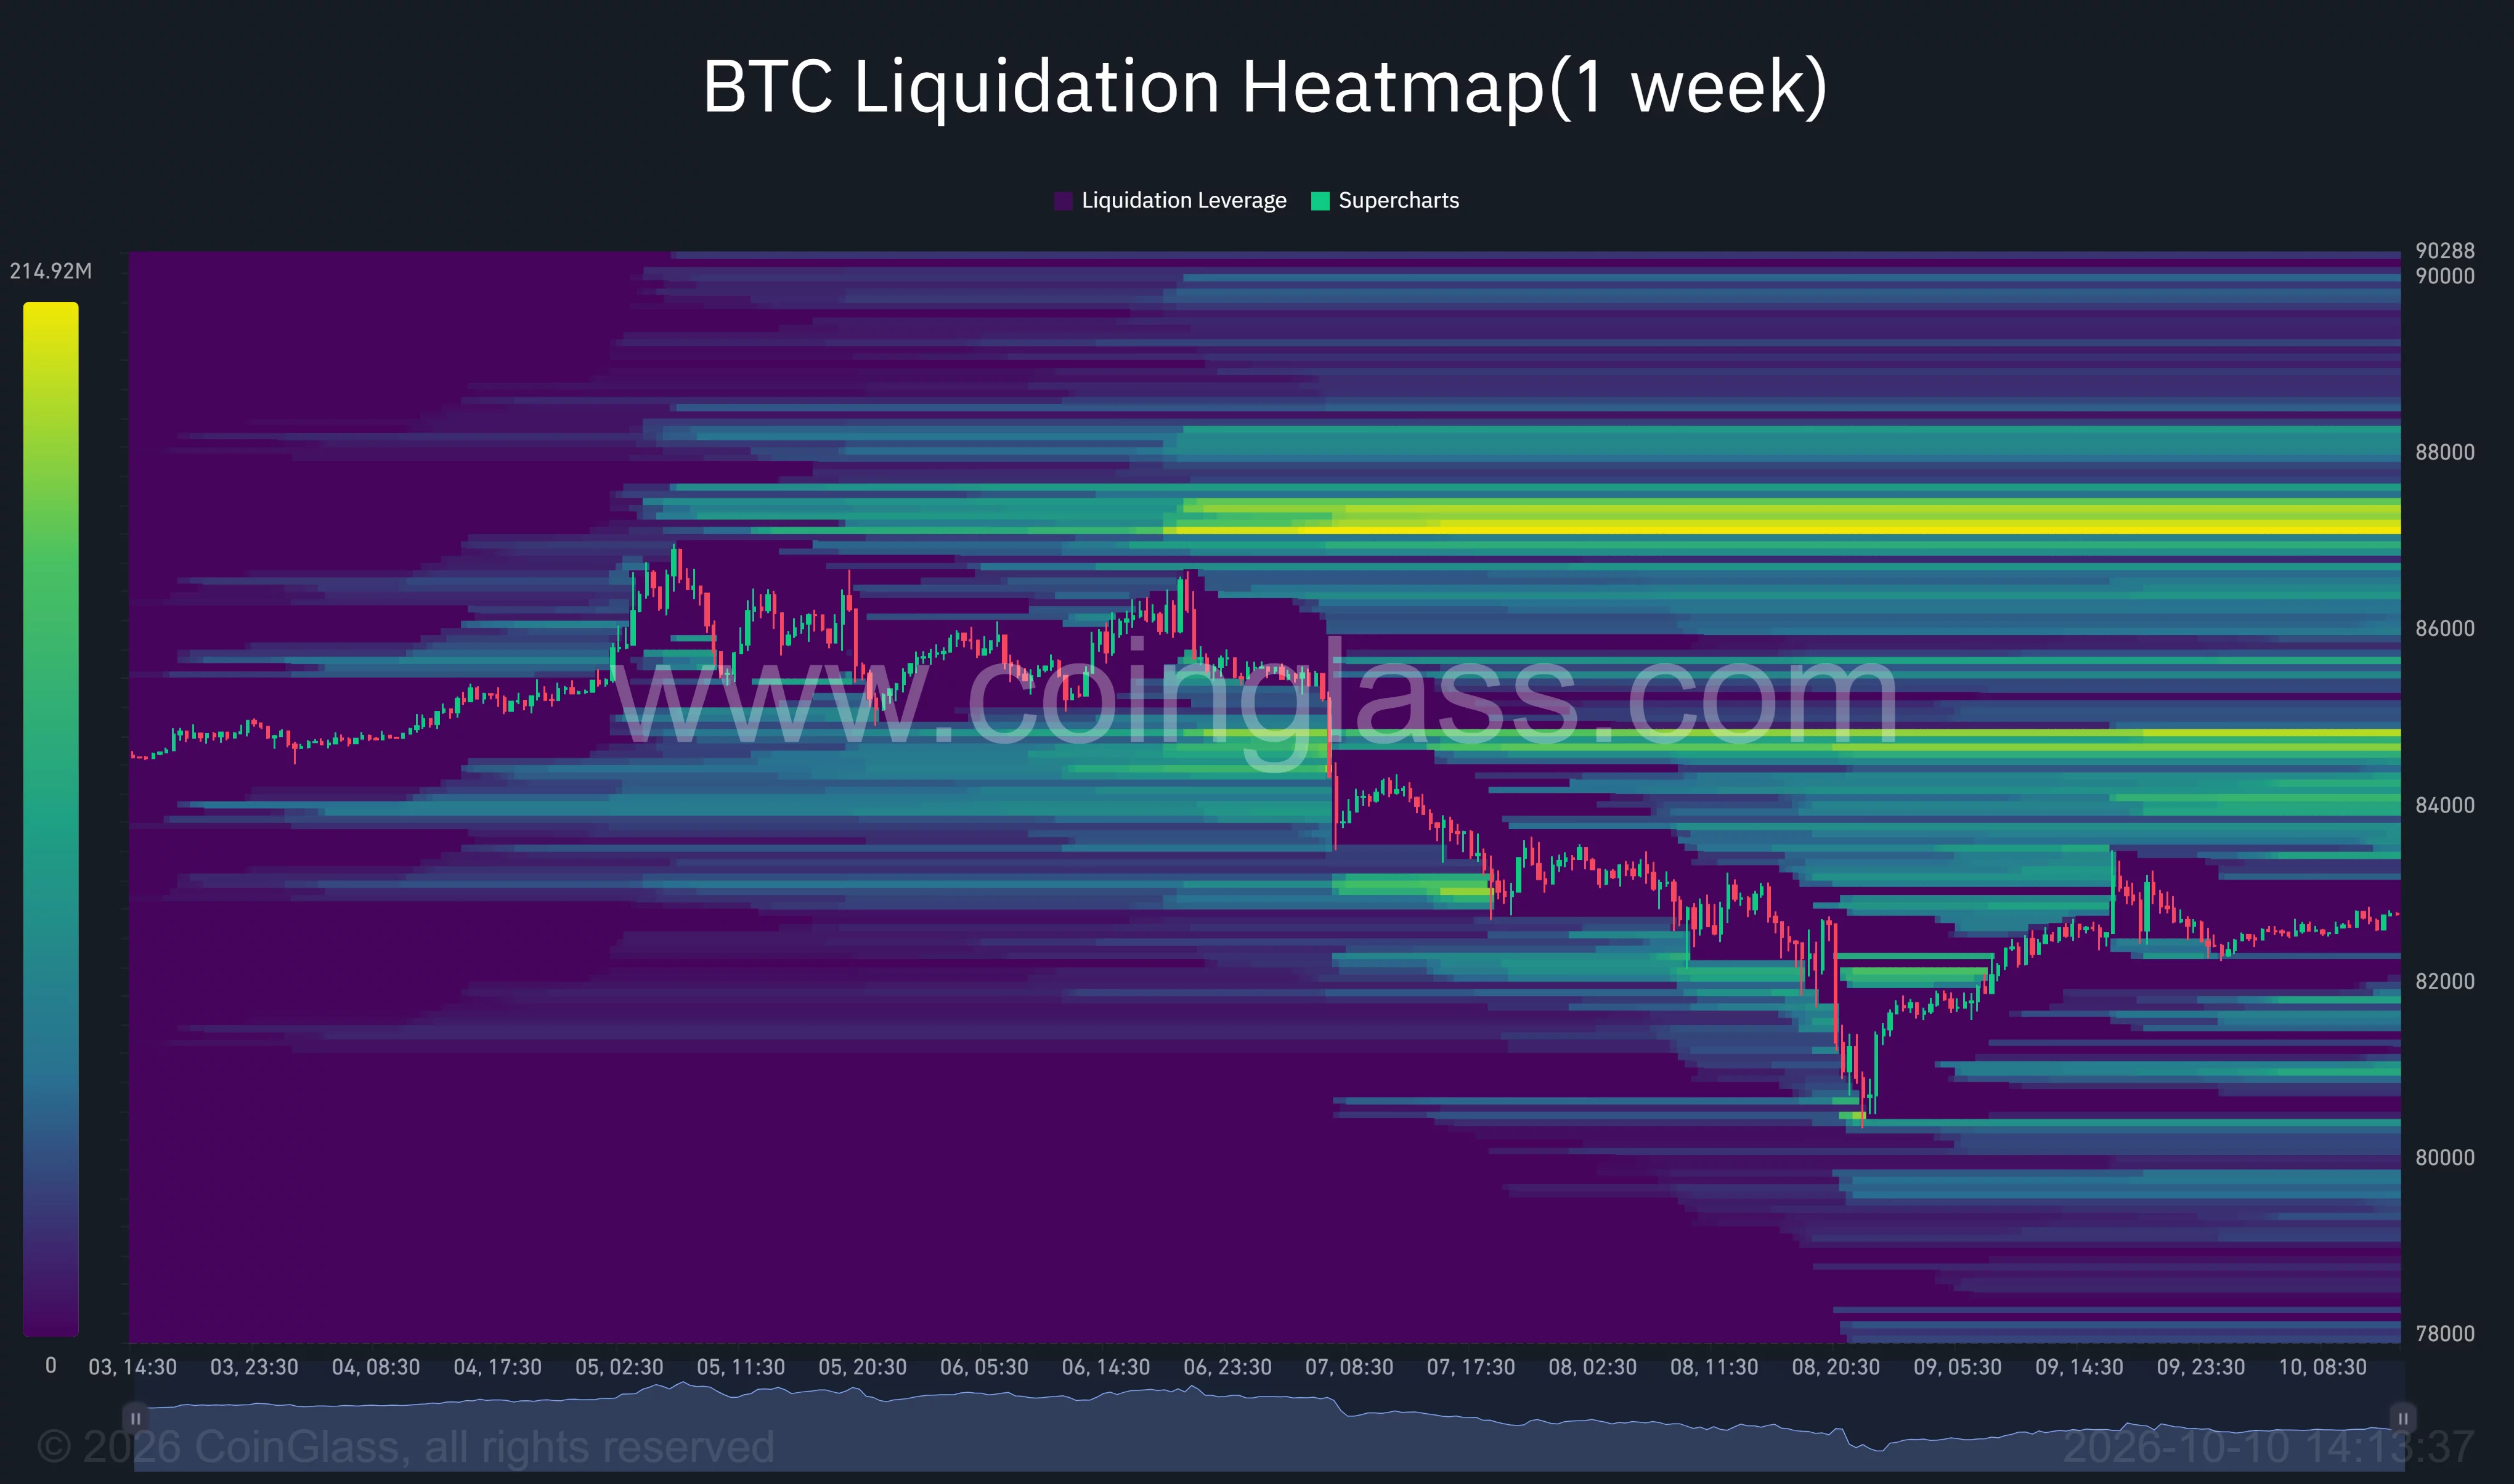
The heatmap records Bitcoin’s descent from the upper-$86,000 area, its sharp drop toward $80,400, and the subsequent recovery toward $82,800. The latest price remains below the stronger overhead bands.
Snyder’s $87,000 scenario therefore lines up with a prominent liquidation concentration on the CoinGlass chart. His nearer $84,000–$85,000 resistance area also overlaps several visible bands above the current market.
Below price, the heatmap shows concentrations around $81,600, $81,000, and $80,400, followed by further bands beneath $80,000. Those levels sit near the moving-average support and recent low visible on TradingView.
The chart-based route toward $87,000 runs through the $84,000–$85,000 area first, while Snyder’s bearish scenario begins with a failure to defend the recent support zone.
U.S. Bitcoin ETF outflows total $678.9 million
Farside Investors’ daily figures show U.S. spot Bitcoin ETFs lost a net $678.9 million across the five trading sessions from Oct. 5–9.
The largest withdrawal came on Oct. 7, when the funds recorded $484.9 million in net outflows. BlackRock’s IBIT lost $207.7 million, Fidelity’s FBTC shed $105.1 million, and ARK and 21Shares’ ARKB recorded $101.7 million in withdrawals.
Another $244.1 million left the funds on Oct. 8, led by $197.1 million from FBTC. Friday brought a smaller reversal, with $21.1 million in net inflows, including $22.4 million into IBIT.
The Friday inflow coincided with Bitcoin’s recovery, but the weekly fund balance remained negative. On the charts, BTC ended the period above the recent low while still below the $84,170–$84,400 resistance cluster.
Snyder’s recovery scenario keeps $87,000 in view if support holds and Bitcoin clears the intervening barriers. His downside scenario leaves another test below $80,000 in play if the $80,400 low gives way.
Disclosure: This article does not represent investment advice. The content and materials featured on this page are for educational purposes only.